
A coordinate plane is just a flat surface (like a piece of paper) where you can plot and find exact locations of points with the help of a 2D Cartesian coordinate system.
The 2D Cartesian coordinate system consists of two perpendicular axes (x-axis and y-axis). These axes divide the coordinate plane into four parts. Each part is called a quadrant.
If you want to picture the coordinate plane in your mind, imagine a completely flat surface covered with evenly spaced horizontal and vertical lines crossing each other, like graph paper. This pattern is called a coordinate grid, and it helps you visualize the coordinate plane and plot points more easily.
In this article, you’ll learn what a coordinate plane and grid are. You’ll study what quadrants are. You’ll also understand graphing on the coordinate plane. So, let’s dive in.
What is a Coordinate Plane Definition in Math?
A coordinate plane is a two-dimensional flat surface on which we plot points, lines, and other geometric objects using a 2D Cartesian coordinate system.
Other names for the coordinate plane are the Cartesian plane, Cartesian coordinate plane, or xy plane.
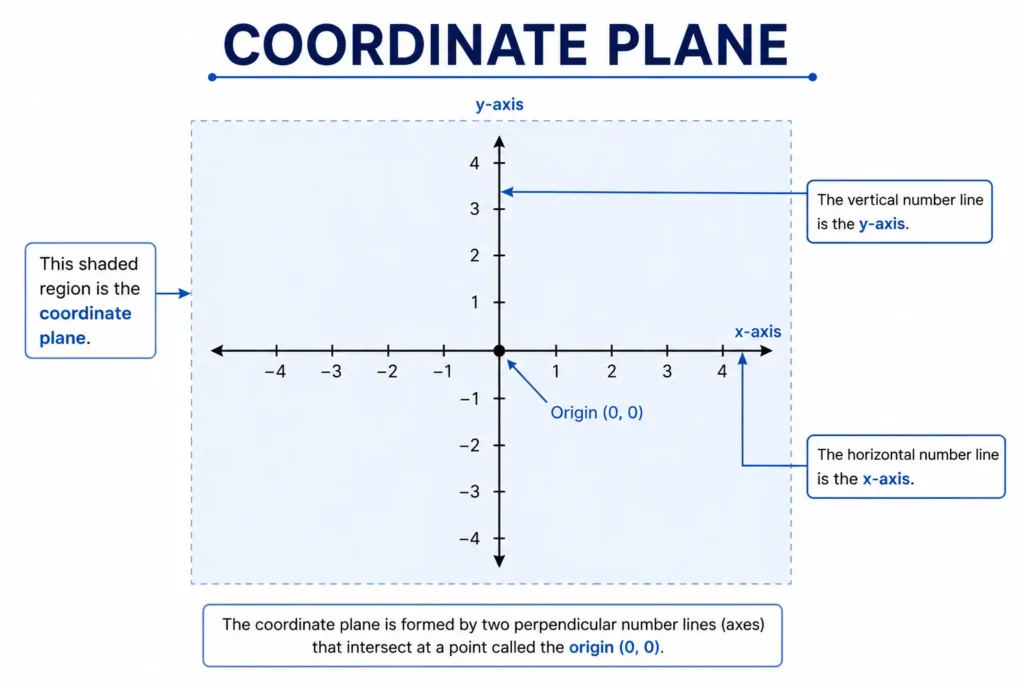
On the coordinate plane, one number line is usually kept horizontal, and the other is usually vertical. The horizontal number line on the coordinate plane is the x-axis. The value on the x-axis is positive as you move to the right and negative as you move to the left from the origin. The vertical number line on the coordinate plane is the y-axis. The value is positive as you move upward and negative as you move downward from the origin.
If you are confused about the Cartesian plane and the 2D Cartesian coordinate system, here is a simple way to understand it. The Cartesian plane is the flat surface where points are plotted, and graphs are drawn. The 2D Cartesian coordinate system is the system or framework used to locate or plot those points using the x-axis, y-axis, and ordered pairs (x, y).
Both work together. The 2D Cartesian coordinate system provides the rules for locating and finding points, and the coordinate plane is the surface where those points are shown visually.
The figure visually shows a coordinate plane used to plot points using the x-axis and y-axis.
The coordinate plane is usually visualized using a coordinate grid.
What is a Coordinate Grid?
A coordinate grid is a set of evenly spaced horizontal and vertical lines drawn on a coordinate plane to visualize it and help you locate points easily.
To better understand this concept, the figure below shows what the coordinate grid looks like.
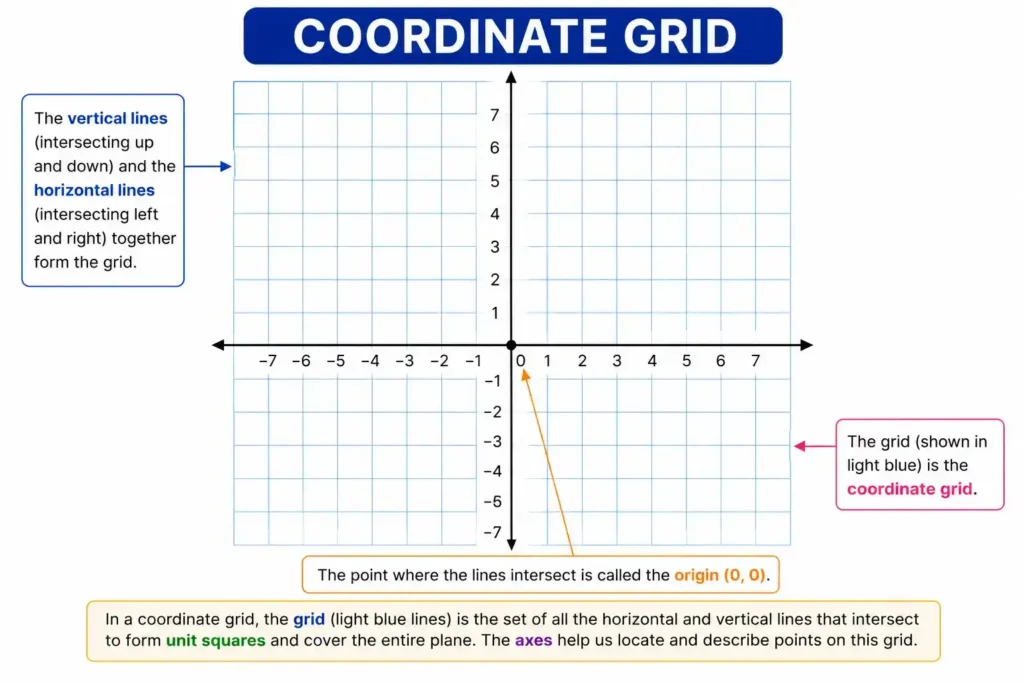
The coordinate grid also makes it easier to locate the position of a point precisely and accurately.
How to Use a Coordinate Grid
To use the coordinate grid correctly, follow the step-by-step procedure
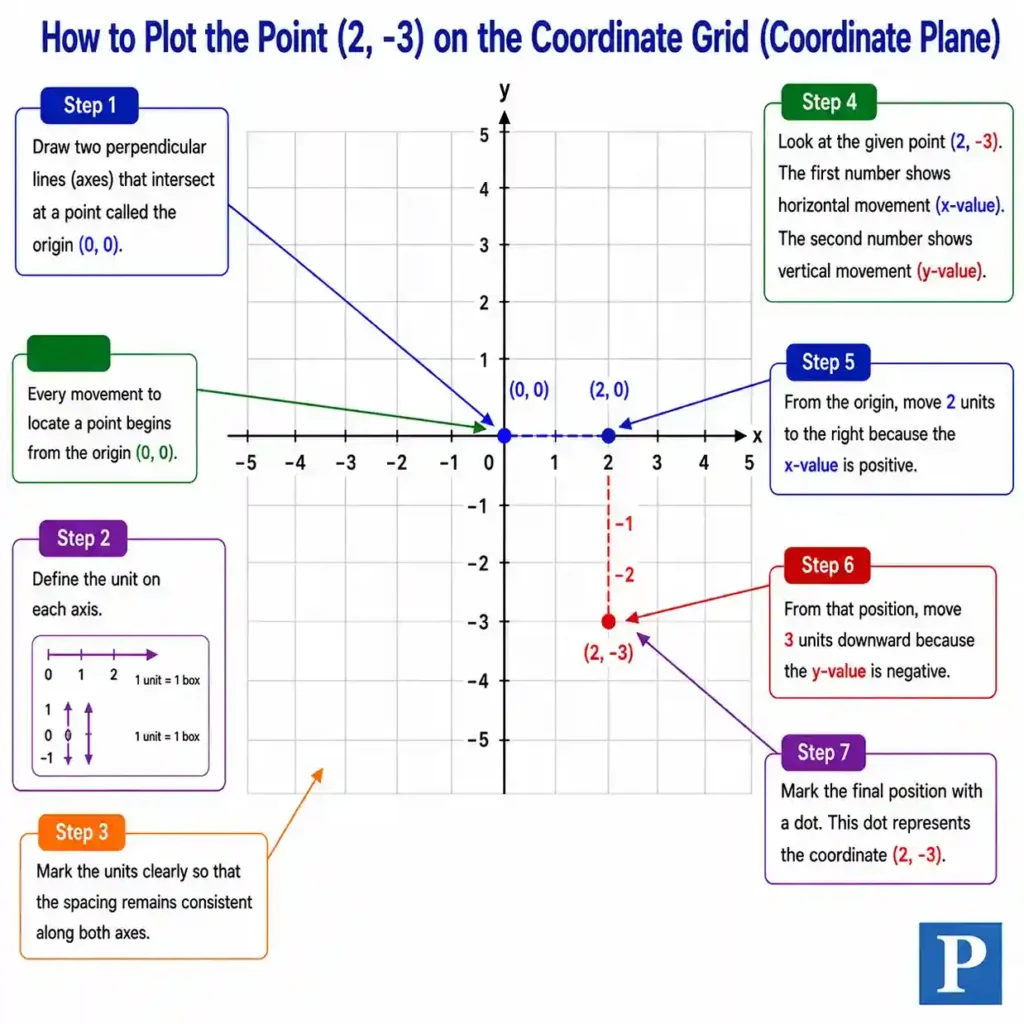
- Draw two perpendicular lines (axes) that intersect at a point called the origin (0, 0). Every movement to locate a point begins from here.
- Define the unit on each axis. One unit may represent one box, two boxes, or even more subdivisions within a unit
- Mark the units clearly so that the spacing remains consistent along both axes.
- Now look at the given point, for example (2, −3). The first number shows horizontal movement, and the second number shows vertical movement.
- From the origin, move 2 units to the right because the x-value is positive.
- From that position, move 3 units downward because the y-value is negative.
- Mark the final position with a dot. This dot represents the coordinate (2, −3).
The coordinate grid shown in the figure below also demonstrates visually how to use it to plot a point like (−2, 3).
What are the Quadrants of a Coordinate Plane?
In a coordinate plane, two reference lines (axes) meeting at a right angle divide the plane into four equal parts, each part is known as a quadrant.
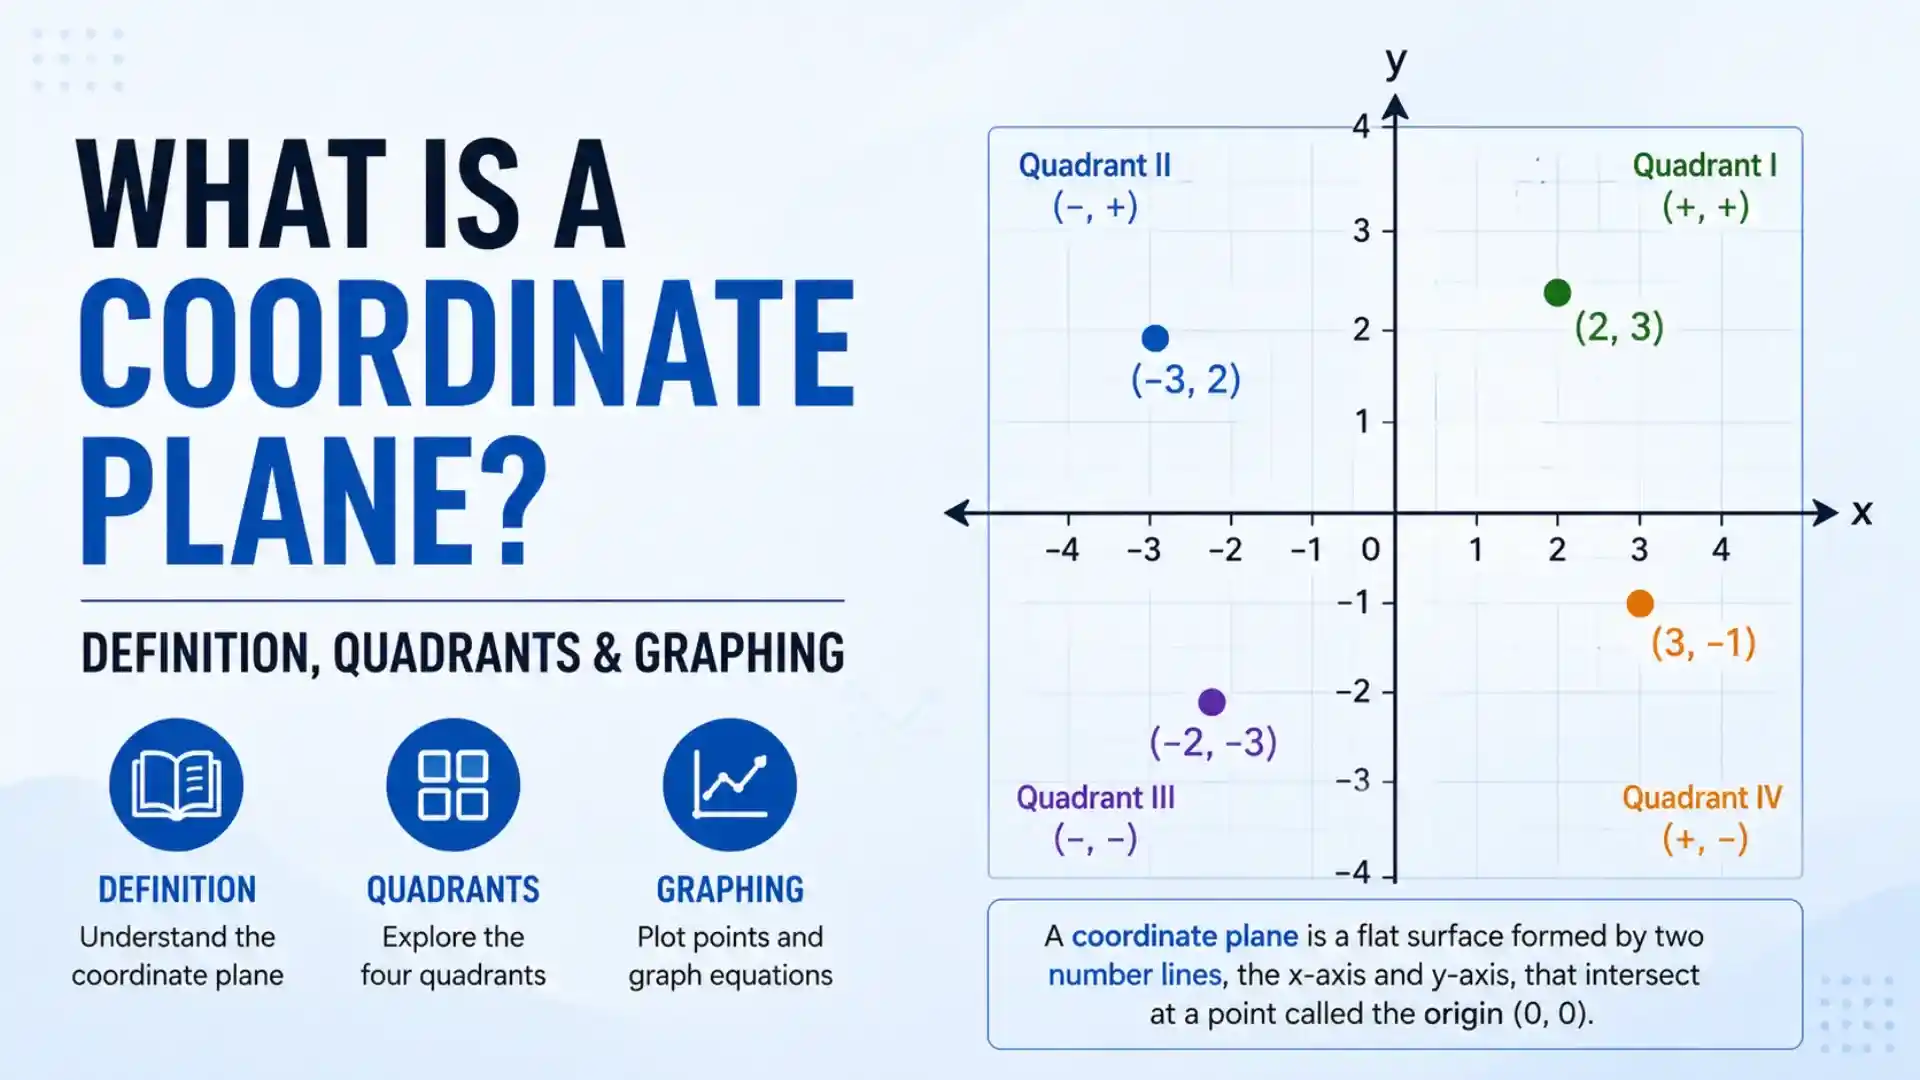
These quadrants are labeled using Roman numerals. To label all four quadrants, begin in the upper right section of the coordinate plane, where both x and y are positive, and then move in a counterclockwise direction.
As you move through each section, the regions are labeled in order: Quadrant I, Quadrant II, Quadrant III, and finally Quadrant IV.
In order to better understand it, I have labeled the quadrants on a graph shown in the image below
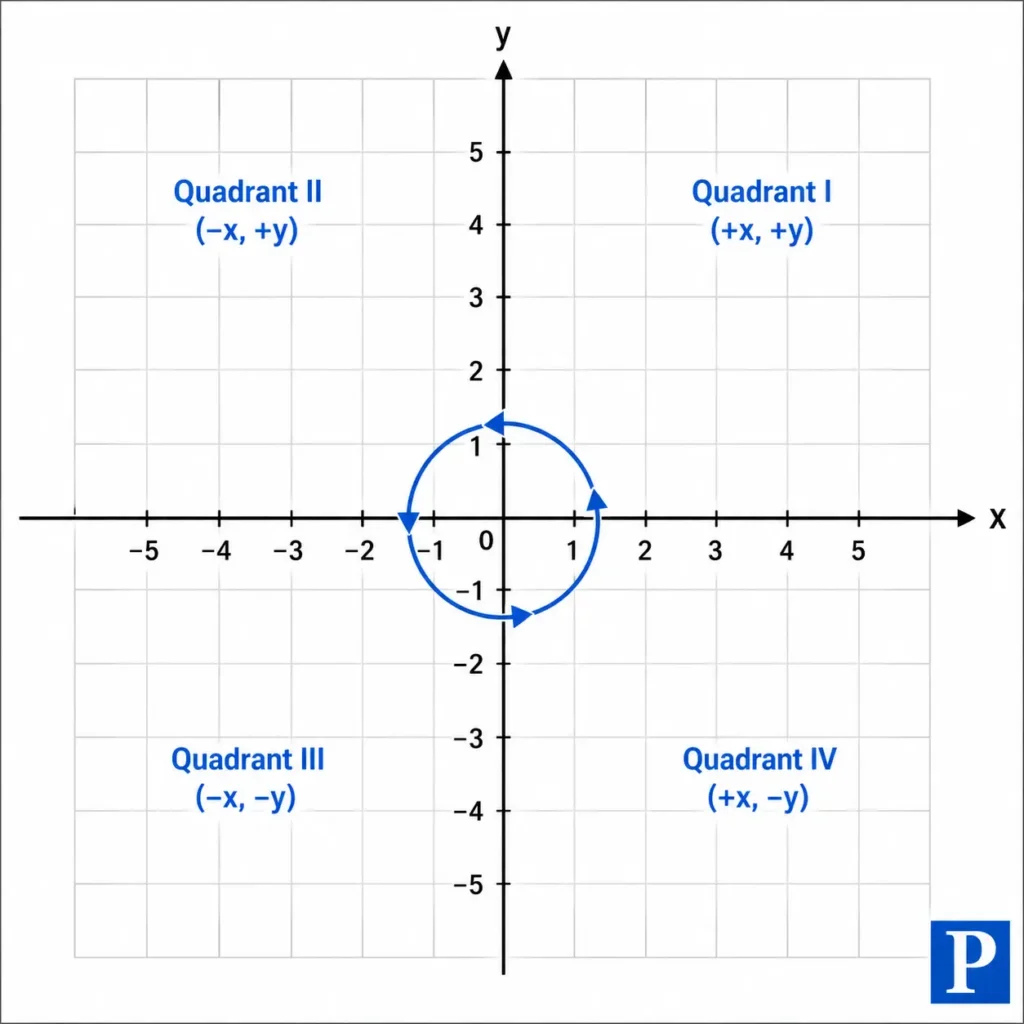
Quadrant I (+,+): The upper right region shown in the graph is the first quadrant labeled as Quadrant I. This quadrant exists in the +x-axis and +y-axis region. As a result, in this quadrant, both x and y coordinates of a point are positive. Points like (4,6) and (1,2) belong here.
Quadrant II (-,+): The upper left region in the graph is the second quadrant labeled as Quadrant II. This quadrant exists in the -x-axis and +y-axis region. Hence, in this quadrant, the x-coordinate is negative, and the y-coordinate of a point is positive. Points like (-3,2) and (-6,5) belong here.
Quadrant III (-,-): The lower left region in the graph is the third quadrant labeled as Quadrant III. This quadrant exists in the -x-axis and -y-axis region. So, in this region, both x and y coordinates of a point are negative. Points like (-3,-6) and (-2,-8) belong here.
Quadrant IV (+,-): The lower right region in the graph is the fourth quadrant labeled as Quadrant IV. This quadrant exists in the +x-axis and -y-axis region. So, in this quadrant, the x-coordinate is positive, and the y-coordinate is negative. Points like (2,-3) and (6,-5) belong here.
Graphing on the Coordinate Plane
Graphing means representing data in a visual format. The purpose of it is to understand the relationship between variables, whether it is linear, quadratic, exponential, inversely proportional, or some other type of relationship. It also helps identify patterns in data.
Most of the time, we use the coordinate plane to draw basic graphs.
On this plane, we plot multiple points and often connect them to form a line or a smooth curve. This representation of points on the plane is what we call a graph. This way, it becomes much easier to see how two things change in relation to each other.
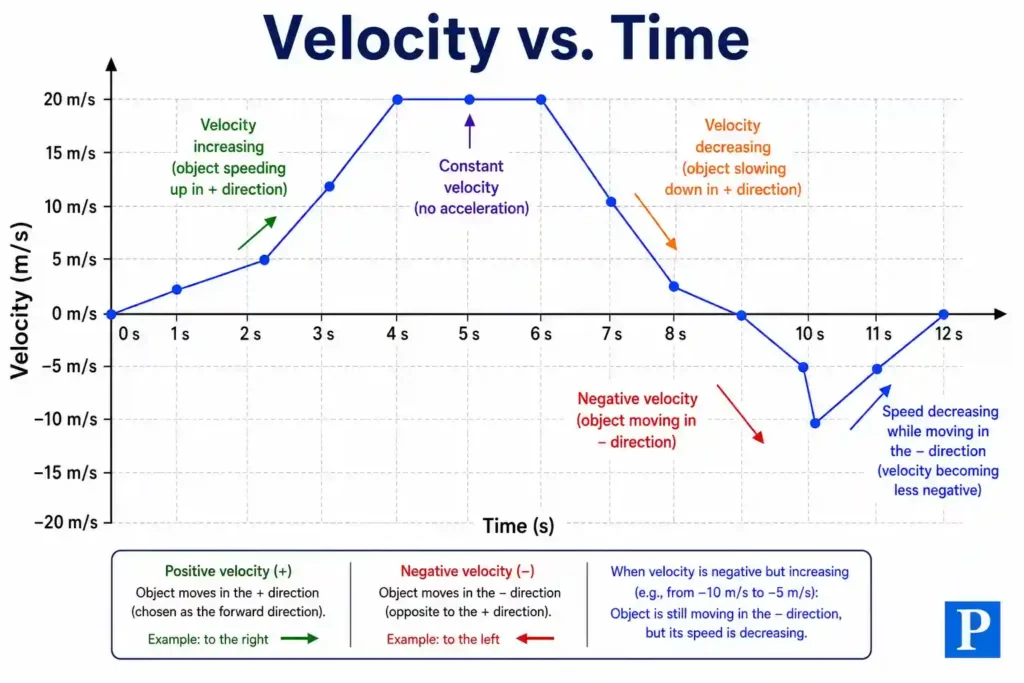
In physics, we use graphs in many situations, such as showing how velocity changes with respect to time or how much displacement an object covers over time.
For example, the image below graphs the change in velocity of an object with time on a coordinate plane.
Distance Between Two Points on Coordinate Plane
To calculate the distance between two points on the coordinate plane, we first plot both points using the 2D Cartesian coordinate system. The exact location of a point is represented by an ordered pair (x, y). Suppose the position of the first point is P1(x1,y1) and the position of the second point is P2(x2,y2).
Now, to find the distance between these two points, we use the distance formula:
This formula is derived using the Pythagorean theorem, as explained in the image below
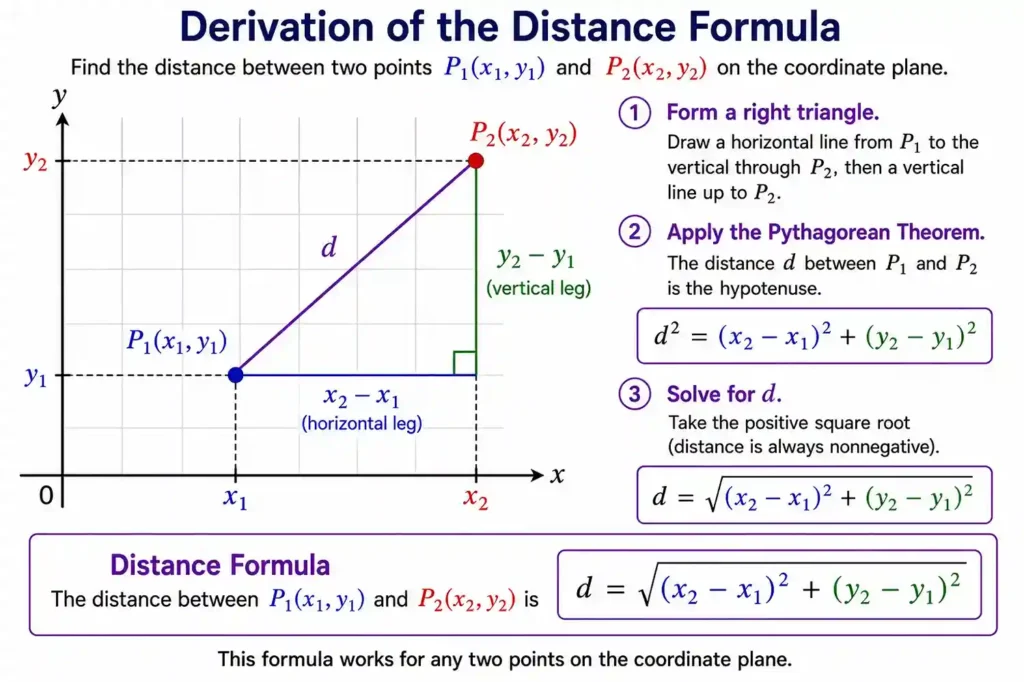
It gives the shortest distance between two points on a straight line in the coordinate plane.