
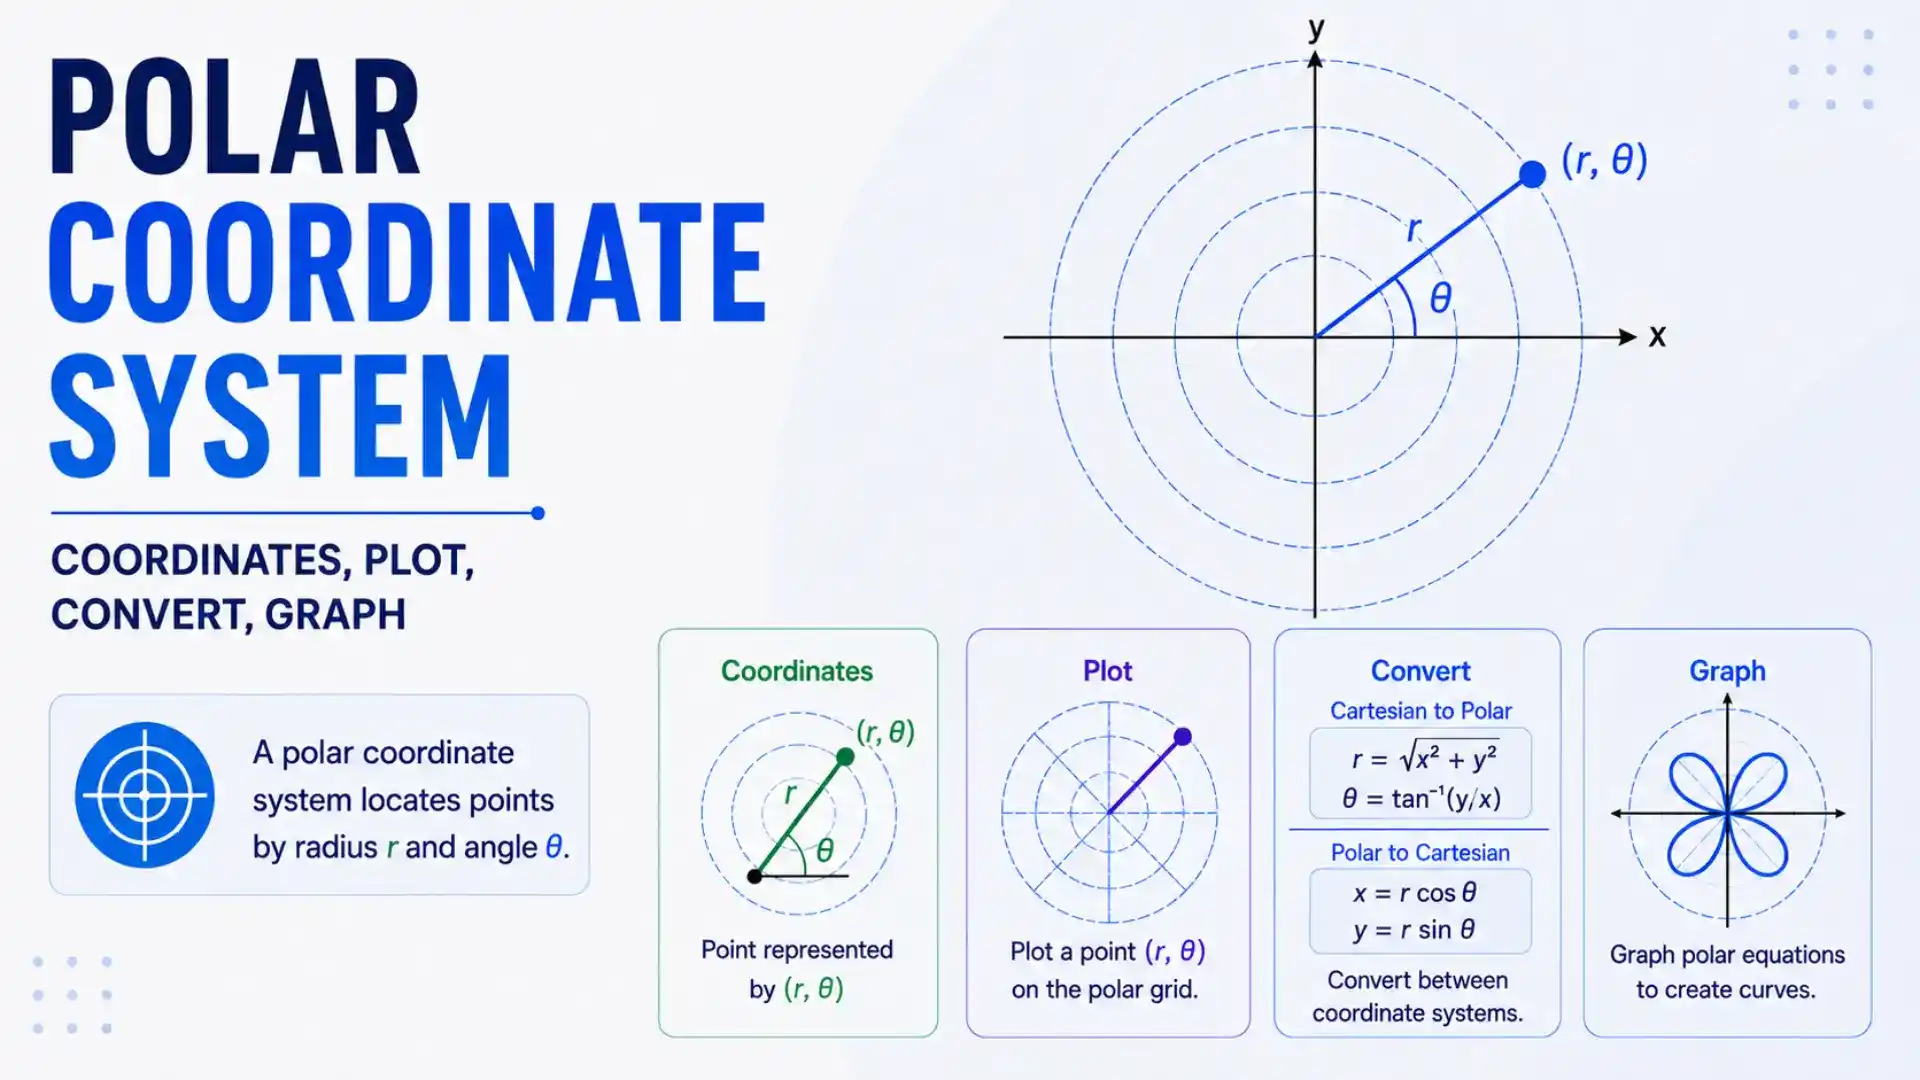
The polar coordinate system is a way of locating points on a plane using polar coordinates (r,θ). The first coordinate r tells you how far the point is from a fixed reference point. The second coordinate θ tells you which direction to move to reach the point by measuring an angle from a fixed reference line.
In the polar coordinate system, the fixed reference point is called the pole. This point is analogous to the origin in the Cartesian coordinate system. And the fixed reference line through which the angle is measured is called the polar axis.
This system helps easily explain circular motion. It is often used in physics and engineering.
This guide explains the basic ideas of the polar coordinate system. You will learn what polar coordinates are and how to mark them on a polar grid. You will also learn how to draw graphs of polar equations. It also explains how to convert polar coordinates into Cartesian coordinates and back again.
What is a Polar Coordinate System Definition?
A polar coordinate system is a two-dimensional system that locates a point on a flat surface by describing how far r it is from the origin (pole) and the direction θ in which it lies. These two values are represented by the radial distance r and the polar angle θ.
It is one of the type of coordinate systems in coordiante geometry.
Polar Coordinates
The polar coordinates that describe the position of a point are defined as:
Radial distance r: This is a straight-line distance from a fixed reference point (pole) to the given point.
Polar Angle θ: The polar angle specifies the direction along which you measure radial distance. It is measured from a fixed reference line called the polar axis, which is usually drawn horizontally to the right and corresponds to the positive x-axis.
Conventions for Polar Coordinates
There are some conventions to follow while writing, plotting, or measuring the polar coordinates; those are as follows
1. The radial distance can be denoted as r or ⍴ (rho). The polar angle is denoted by ɸ (phi) or θ (theta).
2. The order of writing polar coordinates is (r,θ). First radial distance and then polar angle within parentheses.
3. In a polar coordinate system, radial distance (r) is represented by concentric circles. Polar angle (θ) is represented by straight rays (radial lines) that extend outward from the origin.
4. The polar angle can be measured either in degrees (°) or radians (rad). Degrees are easier to understand and visualize for beginners, so they are often used when introducing polar coordinates.
However, the radian is the SI unit of plane angle, and many physics and mathematics formulas are derived using radians. Therefore, angles are often converted from degrees to radians before performing calculations.
5. To measure polar angle, we draw a reference line horizontally in the +x-axis direction and mark it as 0°.
6. We consider the polar angle θ positive when we measure it counterclockwise from the reference line (polar axis). If we rotate clockwise, the polar angle is taken as negative.
7. If the radial distance r is positive, move r units away from the pole in the given direction (polar angle θ). If r is negative, move |r| units in the opposite direction. For example, (-r,θ) represents the same point as (r,θ+180°). Here, 180° represents the opposite direction. In radians, (-r,θ) is equivalent to (r,θ+π).
8. When the radial distance r = 0, the point is always at the pole no matter what the polar angle is.
9. The range of values of radial distance depends on whether you allow negative radial distance or not. For example, if you restrict the radial distance to be positive, the range would be r > 0; if you don’t restrict it, the range would be -∞ < r < ∞.
10. Similarly, for polar angle, if you restrict the polar angle to one cycle, the range is 0 ≤ θ < 360° or -180° < θ ≤ 180°. If you don’t put any restriction, the range is -∞ < θ < ∞.
Are polar coordinates unique?
No, in general, polar coordinates are not unique. A single point can be represented by an infinite number of ordered pairs of polar coordinates.
This is because adding or subtracting full rotations to the polar angle, or using a negative radial distance with the opposite direction, does not change the point’s location.
For example, the ordered pairs (4,30°), (4,390°), and (-4,210°) all represent the same point.
We get 390° after adding a full rotation of 360° to 30°. Since a full rotation brings you back to the same direction, both coordinates represent the same point.
The coordinate (-4,210°) also represents the same point. The point (4,210°) is opposite to (4,30°), as if you add 180° to 30°, you will get 210°, and if you put the minus sign with 4, it means take the opposite of (4,210°), which would be the same position as (4,30°) and (4,390°).
But still, two points cannot have the same polar coordinates. The polar coordinates of two different points would still be different from one another.
If you want to keep polar coordinates unique, you can put the limit on coordinates’ ranges. For radial distance r, the limit will be r > 0, and for polar angle θ, the limit will be 0 ≤ θ < 360° or -180° < θ ≤ 180°.
How to Plot Polar Coordinates in the Polar Coordinate System?
To plot a point in a polar coordinate system, we use a polar coordinate grid consisting of concentric circles and radial lines, as shown in the image below
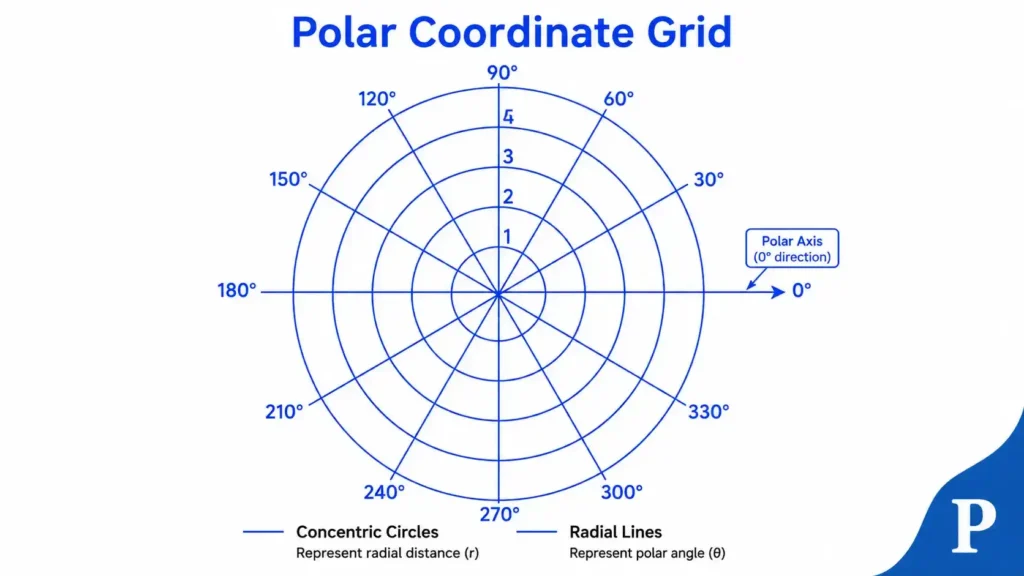
The radial lines represent the polar angle coordinate, and circles represent the radial distance coordinate. The plane on which we draw this polar grid is known as the polar coordinate plane.
Here are the steps to plot a point using polar coordinates in the polar coordinate system
1. Draw a polar grid
2. Identify the coordinates that you require to plot, for example (3,60°)
3. Start at the pole (origin) where both r and θ are zero.
4. First measure the angle. For this, rotate from the polar axis (positive x-axis) in the counterclockwise direction if the angle is positive and in the clockwise direction if the angle is negative.
For our example, θ = 60°. Move 60° from the polar axis in the counterclockwise direction until you reach the 60° radial line.
5. While staying on the radial line at angle θ, move outward from the pole and count the concentric circles until you reach the radial distance r. In our chosen example, r is 3.
6. After covering radial distance r along direction θ, mark the point. These are the polar coordinates of the point (r,θ).
Polar Coordinates Examples
Now, let’s take some examples to better understand plotting points in the polar coordinate system.
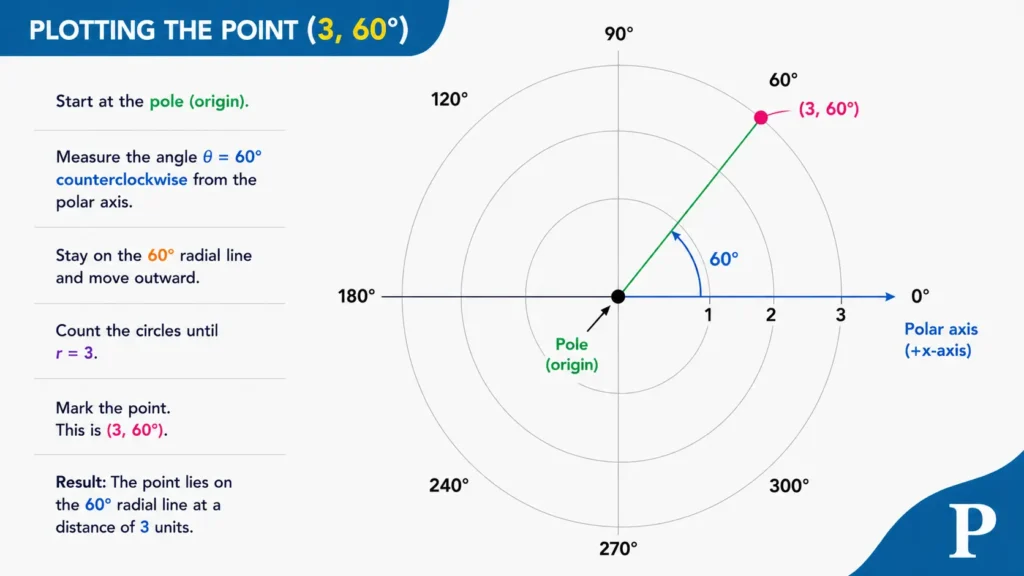
Example 1: Plot polar coordinates (3,60°)
The point (3, 60°) has a radial distance of 3 units and a polar angle of 60°. First, rotate 60° counterclockwise from the positive x-axis on the polar grid. Then move outward 3 units along the 60° radial line and mark the point.
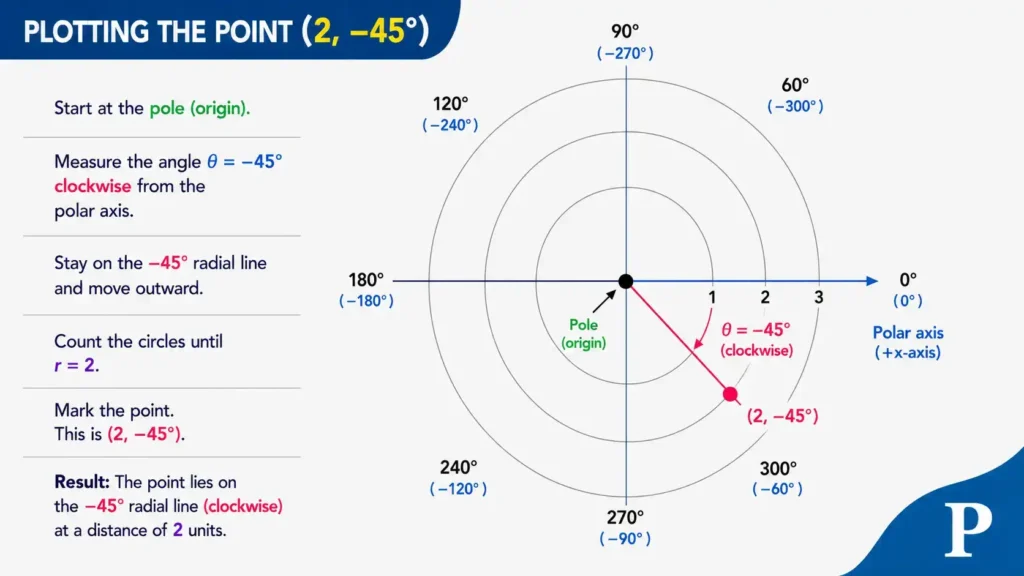
Example 2: Plot the point (2,-45°)
To plot the point (2, -45°), start at the polar axis. Since the angle is negative, rotate 45° clockwise from the polar axis until you reach the radial line at -45°(300°). Then, move outward from the pole along this radial line and count the concentric circles until you reach a radial distance of 2. Mark this location as the point (2, -45°).
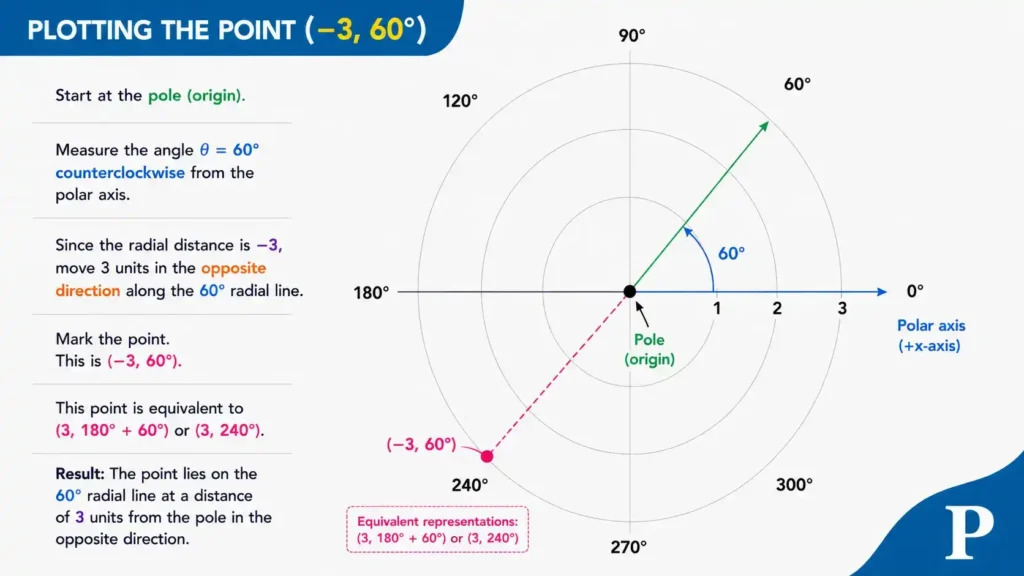
Example 3: Plot polar coordinates (-3,60°) in polar grid.
In this example, we have a negative radial distance of -3 at the polar angle 60°. To plot this point in the polar grid, start from the polar axis and rotate 60° counterclockwise from it. Since the radial distance is -3, move 3 units in the opposite direction along the 60° radial line, then mark the point. This point represents (-3, 60°), (3, 180° + 60°), or (3, 240°).
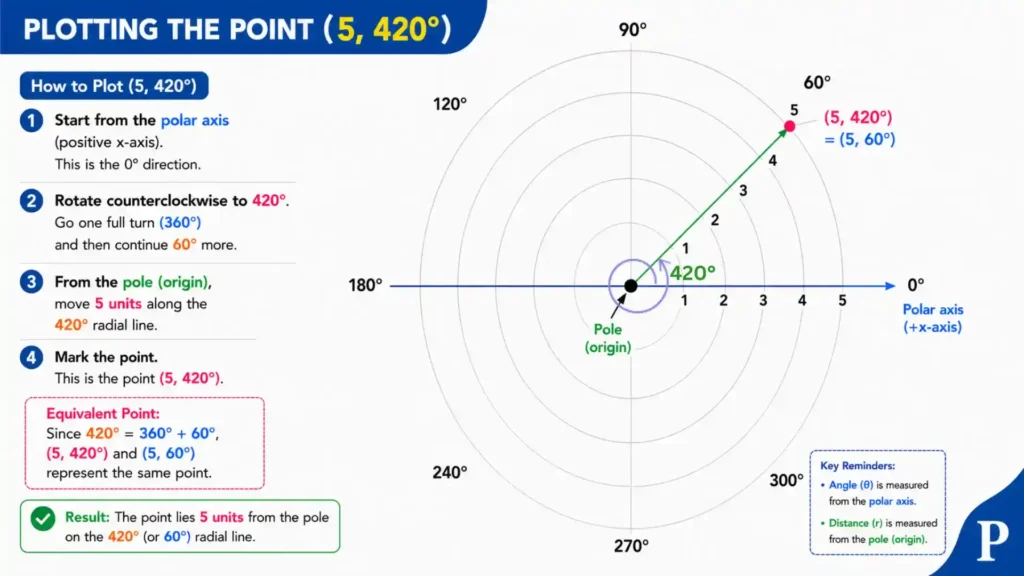
Example 4: Plot the point (5,420°)
Since one full rotation is equal to 360°, to plot this point, first complete one full rotation around the pole and then rotate an additional 60° to reach 420°. From the pole, move 5 units along the 420° radial line and mark the point. This point represents (5, 420°) and is equivalent to (5, 60°) since 420° = 360° + 60°.
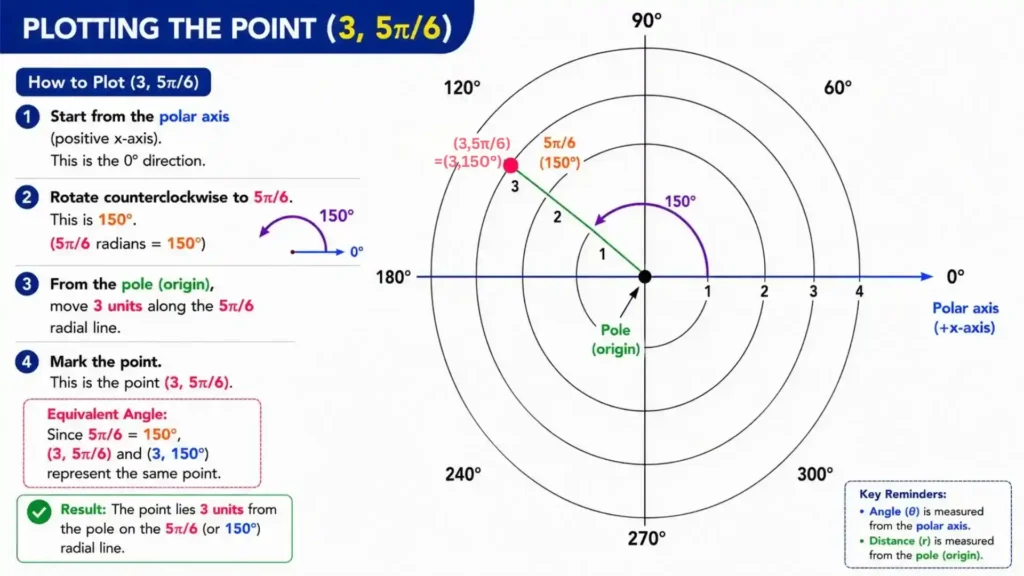
Example 5: Plot the point (3,5π/6)
In this example, the angle is given in radians, 5π/6, where π = 180°. To plot a point, first convert the radians to degrees, which is 5(180°)/6 = 150°. Next, measure an angle of 150° counterclockwise from the polar axis. Then, starting from the pole (origin), move 3 units along the 150° radial line and mark the point. This gives the polar coordinate (3,5π/6).
How to Convert Polar Coordinates to Cartesian?
To convert polar coordinates to Cartesian coordinates, we use the following polar to Cartesian conversion formulas:
x = r cosθ
y = r sinθ
If you know the polar coordinates r and θ, you can put the values of r and θ in the above formulas and get the values of x and y, which are the Cartesian or rectangular coordinates.
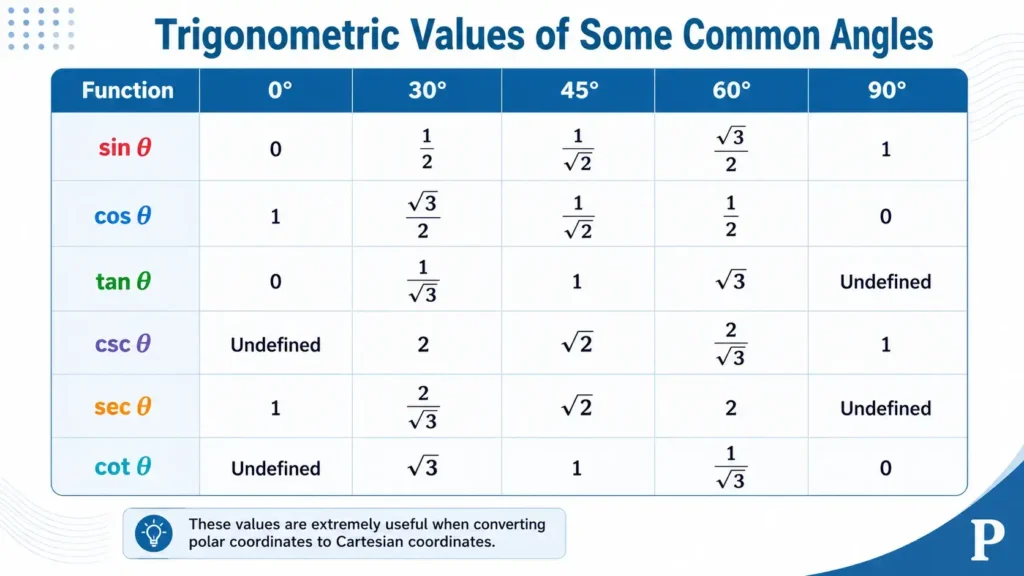
As the formula suggests, to convert polar coordinates to Cartesian coordinates, you will often need the values of sinθ and cosθ. The table below lists the most commonly used trigonometric values.
Example 1: Convert (5, 30°) to Cartesian coordinates.
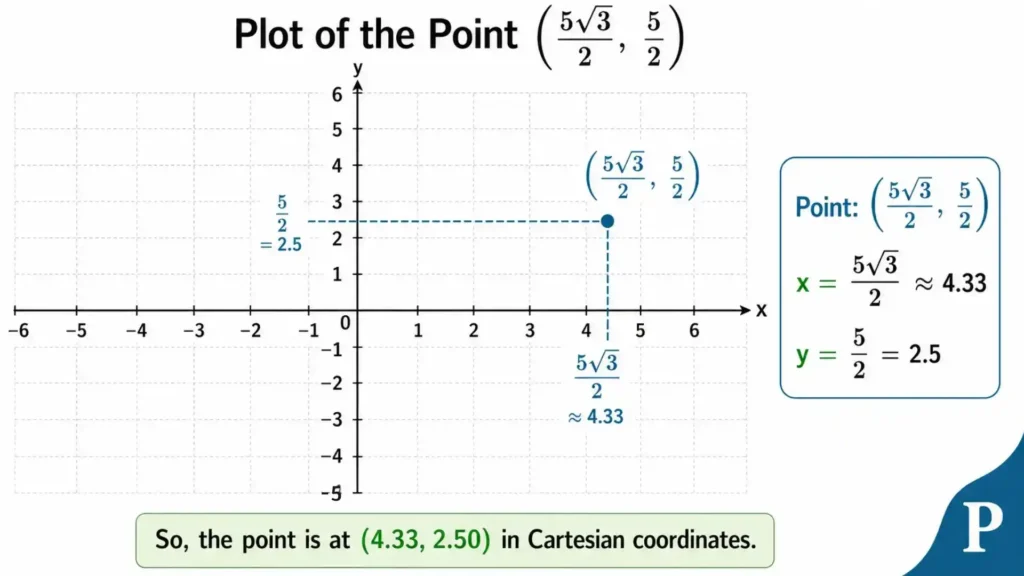
We will use the formula mentioned above to convert (5,30°) into Cartesian coordinates. In this example, we have radial distance r = 5 & polar angle θ = 30°. Putting these values in the above formulas, we have
x = 5 cos30°
= 5 (√3 / 2)
x = 5√3 / 2
y = 5 sin30°
= 5 (1/2)
y = 5 / 2
So, the Cartesian coordinates are (5√3/2, 5/2). To learn how to plot points on the coordinate plane, number line, and 3-dimensional Cartesian space, check out this guide to the Cartesian coordinate system. It also explains how to find the Cartesian coordinates of a plotted point.
Example 2: Convert polar (-5,60°) to rectangular coordinates.
In this example, r = -5 and θ = 60°. Using the polar to Cartesian conversion formulas, we have
x = -5 cos(60°)
= -5(1/2)
x = -5/2
y = -5 sin(60°)
= -5 (√3 / 2)
y = -5√3 / 2
The rectangular coordinates after conversion are (-5/2,-5√3/2).
Example 3: Let’s take one more case in which the angle is negative, i.e., convert polar (2,−45°).
Here, r=2, θ = -45°. By applying the polar to rectangular conversion formula, we have
x = 2 cos(-45°)
y = 2 sin(-45°)
If you know, cos (-θ)=cosθ and sin(-θ) = -sinθ, so
x = 2 (1/√2)
= 2/√2
x = √2
y = -2 (1/√2)
= -2/√2
y = -√2
So, the polar coordinates (2,-45°) become (√2, -√2) in the rectangular or Cartesian coordinate system. In decimal approximation, they are (1.414,−1.414).
If the angle is in radians, the process would be the same.
How to Convert Cartesian to Polar Coordinates?
In order to convert Cartesian coordinates into polar coordinates, we express r and θ in terms of x and y. To transform Cartesian coordinates into polar form, use the following relationships:
r = √(x^2 + y^2)
θ = tan-1(y/x) or arctan(y/x)
tan-1, tan^-1, and arctan mean the same thing. This formula for calculating θ has a limitation.
For example, when the Cartesian coordinates are (1,1), the point lies in the first quadrant, and θ=arctan(1/1)=arctan(1)=45°, which is correct. However, if the coordinates are (−1,−1), the point lies in the third quadrant, but arctan(y/x) still returns 45°. This angle corresponds to the first quadrant, not the third. This happens because the arctangent function alone cannot determine the correct quadrant. To obtain the correct value of θ, the formula must be adjusted based on the signs of the x– and y-coordinates, as shown below in the table
| Conditions | θ in (−π,π] or (-180°,180°] | θ in [0,2π) or [0,360°) |
|---|---|---|
| x>0,y≥0 | tan-1(y/x) | tan-1(y/x) |
| x<0,y≥0 | tan-1(y/x)+π | tan-1(y/x)+π |
| x<0,y<0 | tan-1(y/x) – π | tan-1(y/x)+π |
| x>0,y<0 | tan-1(y/x) | tan-1(y/x)+2π |
| x=0,y>0 | π/2 or 90° | π/2 or 90° |
| x=0,y<0 | -π/2 or -90° | -π/2 or -90° |
| x>0,y=0 | 0° | 0° |
| x<0,y=0 | π | π |
| x=0,y=0 | Undefined (angle has no unique value) | Undefined (angle has no unique value) |
Example 1: Find polar coordinates of a point (-6, 6).
Since x<0 and y>0, we have
r = √(x^2 + y^2)
θ = tan-1(y/x)+π
To calculate r and θ, put the given values of x=-6 and y=6 in the given formula
r = √(-6)2+(6)2
= √36+36
= √72
r = 8.49
θ = tan-1(6/-6) + π
= tan-1 (-1) + 180°; As, π = 180°
= -45° + 180°
θ = 135°
So, the polar coordinates are (8.49, 135°).
Example 2: Find polar coordinates of a point (1,-3 ), if θ in (-π,π].
Since x>0 and y<0, from cartesian to polar conversion formulas and table of conditions discusseda bove we have
r = √(x^2 + y^2)
θ = tan-1(y/x)
To calculate radial distance r and polar angle θ, put the given values x=-1 and y=-3 in the given formulas
r = √(1)2 + (-3)2
= √(1+9)
= √10
r = 3.16
θ = tan-1(-3/1)
= tan-1(-3)
θ = -71.57°
Hence, for the given Cartesian coordinates, the polar coordinates are (3.16, -71.57°).
If the problem does not specify the range of the polar angle θ, check with your teacher or follow the convention used in your textbook or course. Different angle intervals, such as (−π,π] and [0,2π), represent the same point but may produce different values of θ.
For example, the Cartesian point (1, -3) has the polar coordinates (3.16, -71.57°) when θ is restricted to (-180°, 180°], and (3.16, 288.43°) when θ is restricted to [0°, 360°). Although the angle is expressed differently, both polar coordinate pairs represent the same point.
Example 3: Find polar coordinates of a point (5,0).
In this example, the Cartesian coordinates are x=5 and y=0. Since the point lies on the positive x-axis, no rotation from the positive x-axis (polar axis) is needed to reach the point. Therefore, the polar angle is 0 radians (or 0°). To find radial distance r, we have
r = √(x^2 + y^2)
= √52 + 02
= √25
r = 5
So, we have polar coordinates (5, 0°).
To obtain a unique set of polar coordinates from Cartesian coordinates, the polar angle θ is usually restricted to a specific interval, such as (−180°, 180°] or [0°, 360°). Without this restriction, a single point can correspond to infinitely many polar coordinate pairs, since adding or subtracting any multiple of 360° (or 2π) gives the same point.
How to Graph Polar Equations Using Polar Coordinates?
To graph a polar equation, we create a table of θ & r by following the step-by-step procedure given below:
1) Identify the given polar equation and its interval
It is an equation that specifies the relation between radial distance r and the polar angle θ. A solution of a polar equation is an ordered pair of polar coordinates (r, θ). For example, r = 2 cosθ or r2=16cos(2θ). The equation must be in the form r = f(θ). If it is not, try to isolate r first.
If the interval is not given, start with 0≤θ≤2π and watch for when the curve starts retracing itself. Once the curve begins retracing a portion that has already been traced, the repeated points do not add a new part to the graph.
Continue until you’re sure all loops or petals have been traced.
2) Test for Symmetry
Symmetry reduces the number of points that must be calculated to accurately shape the graph of a polar equation. You have to find half of the points and then reflect the same curve to the other half. There are three common types of symmetry in polar equations.
Symmetry around the polar axis: To check this, replace θ with –θ. If the equation remains the same, it means it has symmetry around the polar axis. For example, r = a cosθ
Putting θ = – θ, we have
r = a cos(-θ)
Since cosθ = cos(-θ)
So, we have, again, r = a cosθ.
It shows the equation r = a cosθ has symmetry around the polar axis.
Symmetry around θ=π/2 (90°): To check this, replace θ with π-θ, taking the same example r = a cosθ.
Putting θ = π-θ, we have
r = a cos (π-θ)
Since cos (π-θ) = – cosθ, Using trigonomteric identity Cos (A–B) = cosa cosb + sina sinb
we have
r = – a cosθ
Since this equation contains a negative sign, it is not the same as r = a cosθ. The equation does not satisfy the symmetry condition around θ=π/2.
Symmetry about the pole: To check this, replace r with –r. We have
–r = a cosθ
r = – a cosθ
Since this is again not the same as the original equation r = a cosθ, it fails the symmetry test around the pole. However, if you check the same symmetry for the equation r2 = a cosθ, it would pass the symmetry test around the pole.
Note: If an equation passes any test of symmetry, we can surely say symmetry exists. But if all the tests fail, we cannot surely say that it doesn’t have symmetry around the point or line.
3) Find important points and values
Some points give more information about the graph of a polar equation than others. So, instead of putting random values of θ in the polar equation and getting random polar coordinates (r,θ), it is better to take important points to draw the graph of the polar equation. By doing this, we’ll need fewer calculations of θ & r.
a) Find the points where the graph passes through the pole (r = 0)
Set r = 0 and solve the polar equation for θ. These values tell you the angles at which the curve passes through the pole. It could be more than one.
For example, r = 2 cosθ
By putting r = 0, we have
0 = 2 cosθ
cosθ = 0
θ = cos-10
θ = 90° or 270°.
We get polar coordinates of the given polar equation at r = 0 as (0,90°) and (0, 270°).
b) Find the largest and smallest values of r (If possible)
Finding the largest and smallest values of r shows the overall range of r, i.e., how far r can vary.
For most of the polar equations that you’ll be graphing, the maximum and minimum values are calculated by substituting the maximum and minimum values of trigonometric functions (sinθ, cosθ, and others) respectively in polar equations.
The value of cosθ and sinθ varies in the interval [-1,1], i.e.,
−1≤sinθ≤1
−1≤cosθ≤1
So, their maximum value is 1, and the minimum is -1. If we put these values in the given polar equation, we can find the largest and smallest values.
For equations like r = 6 tanθ, tanθ varies from (−∞,∞); there is no maximum or minimum value, so skip this step for these kinds of equations.
4) Construct a table of values
While constructing the table, put the 3 important values that we calculated in Step 3 and then choose standard angles for intermediate values such as 0, π/6, π/4, π/3, π/2, 2π/3, 3π/4, 5π/6, π, and others. These standard angles are useful because their sine and cosine values are familiar to most of the students.
5) Plot the points and connect them in the correct order to form a smooth curve
Now you have values of r corresponding to each θ. Plot these points on the polar grid using polar coordinate rules and conventions mentioned above.
Connect points in increasing (or decreasing) order of θ. As θ increases continuously, imagine a pencil moving continuously along the curve. Connect each point to the next point for the next angle, not to whichever point is closest.
Example of Graphing a Polar Equation
Graph polar equation r = 1 + cosθ
Step 1: Identify the polar equation r = 1 + cosθ
Step 2: Test the symmetry
Symmetry around the polar axis: Put θ = – θ in the polar equation
r = 1 + cos (-θ)
Since, cosθ = cos (-θ), we have
r = 1 + cosθ
Hence, symmetry holds around the polar axis.
Symmetry around θ=π/2 (90°): Put θ = (π-θ),
r = 1 + cos (π-θ)
Using the trigonometric identity Cos (A–B) = cosa cosb + sina sinb
We have cos (π-θ) = -cosθ, then
r = 1 – cosθ
Which is not the same as the given polar equation. Hence, the symmetry test fails around θ=π/2.
Symmetry about the pole: To check this, replace r with –r. We have
– r = 1+cosθ
This is not the same as the given polar equation, so the symmetry test fails around the pole.
Step 3: Put r = 0 in the given polar equation
0 = 1 + cosθ
cosθ = -1
θ = cos-1 (-1)
θ = π (180°)
At r = 0, we have polar coordinates (0, 180°)
The value of cosθ varies over the interval [-1, 1], i.e., -1 ≤ cosθ ≤ 1.
To find the maximum value of r, put the maximum value of cosθ, which is 1. We have
r = 1 + 1
r = 2
Since cosθ is 1 at 0 radians or 0°, at the maximum value, we have polar coordinates (2,0)
In this equation, the minimum value is at r = 0. So, no need to find it again.
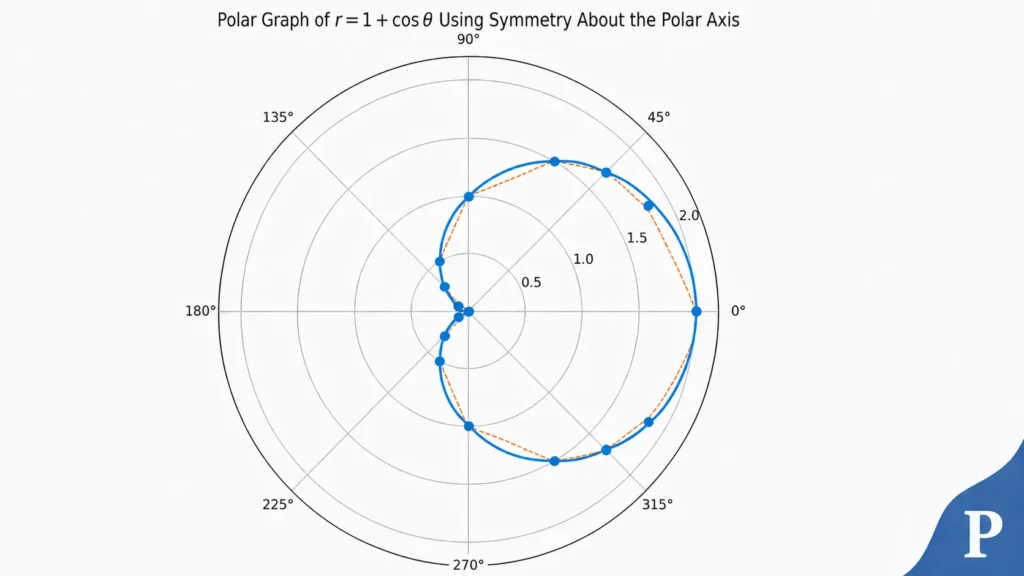
Step 4: From the symmetry test, we know that the polar equation r = 1 + cosθ holds symmetry around the polar axis, so we only need to draw half of the graph from 0 to π and then reflect the shape of the graph for the 2nd half. Put the values of r = 0, where r is maximum, and other values at standard angles for a polar equation r = 1 + cosθ.
| θ | r |
|---|---|
| 0 (0°) | 2 |
| π/6 (30°) | 1.8 |
| π/4 (45°) | 1.7 |
| π/3 (60°) | 1.5 |
| π/2 (90°) | 1 |
| 2π/3 (120°) | 0.5 |
| 3π/4 (135°) | 0.3 |
| 5π/6 (150°) | 0.1 |
| π (180°) | 0 |
Step 5: Plot and Connect the points on Polar Grid
By plotting and connecting points and using the concept of symmetry around the polar axis, we have the polar graph visualization as follows:
How to Calculate the Distance Between Two Polar Coordinates?
To calculate the distance between two polar coordinates (r1,θ1) & (r2,θ2), we use the polar distance formula, which is given as
Polar Distance Formula = d =√(r12+r22 – 2r1r2cos(θ1 – θ2))
The polar distance formula can be derived using either the Law of Cosines or the distance formula for two points in Cartesian coordinates.
Example: Find the distance between (4, 30°) and (-3, 140°)
In this example, r1 = 4, r2 = -3, θ1 = 30°, and θ2 = 140°. Using the polar distance formula, we can find the distance between two given polar coordinates (4, 30°) and (-3, 140°).
d = √((4)2 + (-3)2 – 2(4)(-3)cos(30° – 140°))
= √(16+9+24cos(-110°))
d = √(25+24(-0.34))
= √(25-8.16)
d = √16.84
d = 4.10 units
Polar Vector Representation
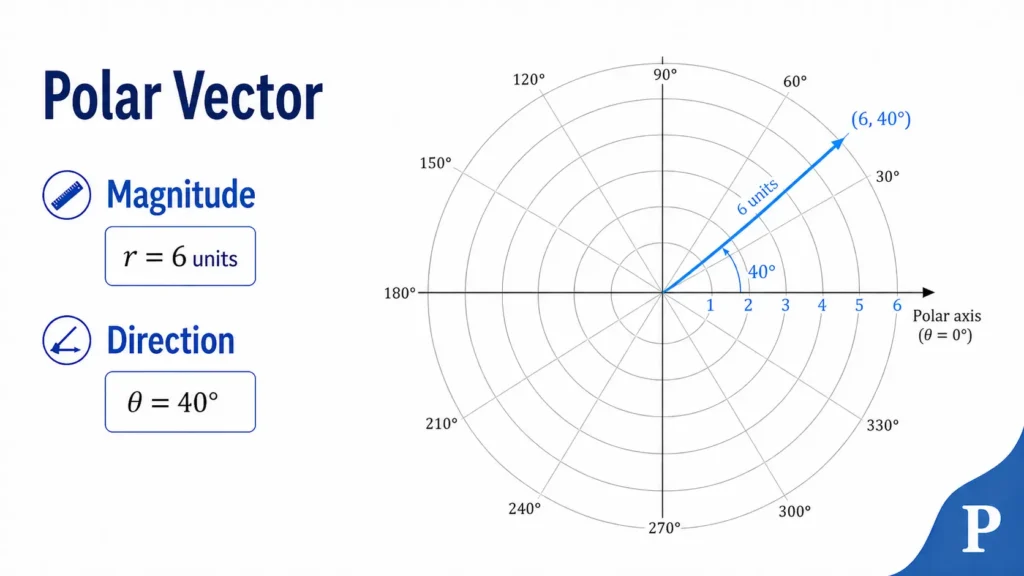
Just like to represent cartesian vector we use cartesian coordinates, we use polar coordinates to represent a polar vector. A polar vector is a vector that uses the radial distance r to represent its magnitude and the polar angle θ to represent its direction.
Mathematically, it is written as
A = (r,θ)
The letter A is bold because it represents a vector.
Polar Vector Example: Suppose a vector has a magnitude of 6 units and points at an angle of 40° from the polar axis (positive x-axis).
Its polar representation is: A = (6,40°)
Some of the polar vector examples in physics are
Displacement: A particle moves 6 m at 40° from the polar axis (6, 40°),
Force: A force of 50 N acts at 45° above the polar axis (50, 45°), and
Acceleration: A car accelerates at 4 m/s² in the direction of π/3 from the polar axis (4, π/3).
