
Accuracy and precision are two different but closely related concepts used to evaluate the quality of measurements.
You might be baking a cake, measuring the dimensions of your room, or conducting a physics experiment. In all cases, knowing how consistent and trustworthy your measurements are can make a big difference.
This guide explains accuracy and precision in simple terms with examples, highlights their key differences, and explains how we can improve them.
What is Accuracy with Examples?
Accuracy refers to how close a measured value is to the true or accepted reference value.
We quantify it by calculating the measurement error:
Measurement error = Measured value – True or Accepted value
The closer the measured value is to the true or accepted value, the less the measurement error and the higher the accuracy.
In the real world, the true value of a quantity is always unknown. To assess accuracy, we use a reference value or accepted standard.
For instance, the speed of light in a vacuum is 299,792,452 meters per second. This quantity is treated as a reference value.
When you carry out an experiment to find the speed of light, you check how close your measured value is to this accepted figure. If the gap between your measurement and the benchmark is very small, we consider the measurement highly accurate.
In some cases, an accepted or reference value may be provided by a reliable source, such as a teacher, a trusted textbook, or a reputable website.
In other cases, you won’t have any true, accepted, or reference value. Here, if the measurement uncertainty is low, it is more likely that the measured value is close to the true value, indicating higher accuracy.
That’s why textbooks often mention uncertainty when discussing accuracy, because uncertainty quantifies the range within which the true value is expected to lie. However, uncertainty and accuracy are not the same. Uncertainty expresses the possible spread or doubt in a measurement, while accuracy describes how close a measurement is to the true or accepted value.
Examples of Accuracy in Physics and Everyday Life
In physics, accuracy is important when you want to be as close to the accepted value as possible. It helps us recognize whether there is any systematic error in our measurement.
Measuring the Acceleration Due to Gravity (g)
At sea level, the standard acceleration due to gravity is 9.81 m/s². If an experiment produces a measurement near this value, we consider the measurement accurate. The nearer your result is to 9.81 m/s², the greater the accuracy of your measurement.
Determining the Speed of Light
The accepted value of the speed of light in vacuum is 299,792, 458 m/s. If you measure its value in a vacuum and obtain a result close to the true value, your measurement is highly accurate.
Accuracy is not only important in science and measurements; it also plays a big role in our daily lives. Here are some examples:
Timekeeping
Our day-to-day tasks highly depend on time. If the time on your clock or watch doesn’t match the official time, it can cause delays and missed appointments.
Accurate timekeeping ensures we stay on schedule and coordinate our activities effectively.
Weather Forecasts
Many outdoor games, such as football, cricket, and hockey, depend heavily on weather forecasts. It’s not just about sports; many of your daily activities, such as going to school or visiting a favorite place, are also affected by the weather.
You need an accurate weather forecast to plan these activities safely and efficiently.
Shopping and Payments
When you go shopping, and the payment depends on the weights of the items, the digital scale must measure the weights accurately. Otherwise, you might end up paying more than necessary. Or you could buy less than you actually need.
What is Precision with Examples?
Precision refers to how close repeated measurements are to each other, regardless of whether they are close to the true value.
High precision means the measurements are consistent and show little variation, and vice versa.
You can calculate the precision of the spread using the mean deviation method as follows:
- Find the mean of all measurements.
- Find the absolute difference of each measurement from the mean.
- Average these differences
This is the same method that you use to calculate the uncertainty of multiple measurements.
But there is one difference between precision and uncertainty. To calculate uncertainty, you have to correct all the known errors. But for precision, you don’t need to do that.
For common practice in physics, we take the best estimate. So, it is compulsory to correct all the known errors. That’s why uncertainty is often equated with precision.
For example, if a measurement has an uncertainty of ±0.1 m, the results can vary within a 0.1 m range. If the uncertainty is ±0.01 m, the results vary within a 0.01 m range. Which measurements do you think are closer to each other? Of course, the one in the 0.01 m range.
Also, the uncertainty ±0.5 is less precise than ±0.1. So, the higher the uncertainty, the less the precision.
Sometimes, it is obvious from measurements that either they have low precision or high precision as compared to each other. But if it is not very obvious, you can use the mean deviation method to calculate the precision of each.
Precision in Significant Figures
When we talk about significant figures, we are not usually talking about uncertainties, like ±0.5 or ±0.1
That small difference does not change the number of significant figures.
What really matters is where the last digit is.
For example:
12.3 (last digit in tenths place and uncertainty is like ±0.1)
12.30 (last digit in hundredths place and uncertainty is like ±0.01)
12.305 (last digit in thousandths place and uncertainty is like ±0.001)
That scale change directly changes the number of significant figures.
So in significant figures, “precision” means how far to the right the last reliable digit goes. More significant figures mean the last digit is in a smaller place value, which means smaller uncertainty.
And smaller uncertainty means higher precision.
That’s what we mean when we say more significant figures give more precision.
Relative Precision:
Relative precision shows how much a measurement can vary relative to the size of the quantity measured.
In many physics textbooks, precision is mentioned as 1 part in 10,000. What does it mean? If you understand basic mathematics, you probably recognize that we use this kind of language when dealing with fractions.
So, this is a fractional precision (or relative precision), that we calculate using the formula
Fractional (or Relative) precision = Absolute precision / Measured value
As in physics, precision is represented by uncertainty. So we can write this formula as,
Relative precision = Absolute uncertainty / Measured value
The phrase ‘1 part in 10,000’ in precision means there is 1 unit of variation in every 10,000 units of a quantity. It shows how small the variation is relative to the total value. For example, if you measure 10,000 meters, the measurement could vary by about ±1 meter.
Examples of Precision in Physics and Everyday Life
In physics, precision is important when your goal is to get the same result each time you measure something. It helps us recognize whether there is any unusual behavior in our measurement process. It also shows how consistent our measurements are.
Measuring the Length of a Metal Rod
When a student measures the length of a metal rod using a vernier caliper and gets readings like 15.24 cm, 15.23 cm, 15.24 cm, and 15.25 cm, the measurements are very close to each other. This shows high precision because the variation between readings is very small.
If the readings were 15.10 cm, 15.35 cm, 15.28 cm, and 15.18 cm, the spread would be larger, which means low precision.
It doesn’t matter whether the measurements are accurate or not. The only thing that matters is how close they are to each other.
Measuring Mass with a Digital Balance
When measuring the mass of an object using a digital balance, repeated readings such as 250.002 g, 250.003 g, and 250.002 g indicate very high precision. As they are very close to each other.
The real weight of the object could be around 300.005 g, but it doesn’t matter while calculating precision.
Precision is not limited to physics only, it also affects our day-to-day life. For example,
Archery Session
If you are practicing archery and aiming for the bullseye, your arrows may land far from the center. But as long as they land close together, your shots have good precision.
The problem is your aim, not your consistency. If you adjust your aim slightly, you can start hitting the bullseye consistently.
Bathroom Scale Reading
You step on your scale, and it says 70.2 kg. You step off and back on multiple times, and it keeps showing 70.2 kg.
But when you look in the mirror each time you measure weight, you notice that you’re gaining weight. But the scale is still showing the same reading. It means your scale is precise, but is not giving a correct reading.
Exercising or Fitness Tracking
Precision in exercise or fitness tracking means the device shows consistent results when measuring the same activity repeatedly.
For example, if you run around 5 km every day and your device shows 4.5 km each day, the device is precise because it gives the same reading consistently. However, it is not accurate because the true distance is 5 km.
What are the Differences between Accuracy and Precision?
By now, you should understand what measurement accuracy and precision mean. It is also helpful to look at a side-by-side comparison to grasp these concepts better.
Let’s understand the differences between them with the help of a table
| Accuracy | Precision |
|---|---|
| Accuracy measures how close a single measurement is to the true or accepted value. | Precision shows how close the repeated measurements are to each other. |
| It focuses on the correctness of measurement. This shows how close the results are to reality. | It focuses on consistency in the value of repeated measurements. This shows how consistent and repeatable the results are. |
| Accuracy is mainly affected by systematic errors. Large random errors can make individual measurements deviate from the true value, but the main threat to accuracy is systematic error. | Precision is mainly affected by random error and the resolution of the instrument. |
| It is usually calculated as a measurement error. | Statistical methods like the mean deviation method or the standard deviation usually calculate it. |
| A single measurement is enough. Even if we take a set of measurements, we match them individually with the accepted value. | Two or more measurements are required to define precision. |
| It will be used when you want a valid result. | It will be used when you want a consistent result. |
There is one more way to look at how they differ from one another. For this, we take four scenarios.
- Precise but not accurate
- Accurate but not precise
- Accurate and precise
- Not precise and not accurate
To understand these scenarios, let’s use the example of archery. Imagine that each arrow you shoot represents one measurement.
The center of the target, the bullseye, represents the true or correct value. That is what you are aiming for.
If an arrow lands close to the bullseye, it means the measurement is close to the true value. In other words, it is accurate. If an arrow lands far from the bullseye, it means the measurement is far from the true value. That measurement would be inaccurate.
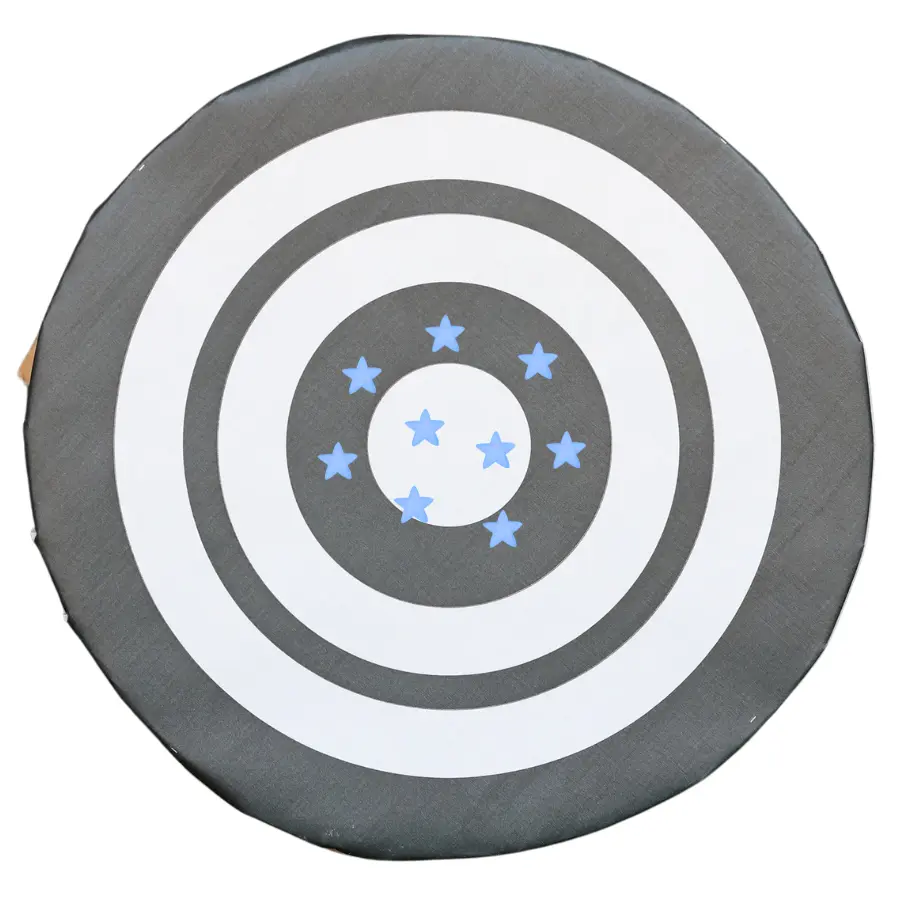
Precise But Not Accurate

In the image above, the point where each arrow hits is marked with a star. As you can see, the stars are very close to one another.
This shows that the shots are very consistent, which means they are highly precise. However, the cluster of stars is positioned away from the bullseye, which means the shots are not close to the true target. So, they are precise, but not accurate.
This example tells us that if you’re getting the same or very close results each time, it doesn’t mean you’re correct. You’re just precise. To be accurate, you have to compare your results with the accepted or true value.
Accurate But Not Precise
The image shows that most shots hit the bullseye or land very close to it. However, they aren’t grouped tightly together. It means the measurements are accurate but not precise enough.
Accurate and Precise
Measurements are called accurate and precise if they are very close to the accepted value and also very close to each other. For example,
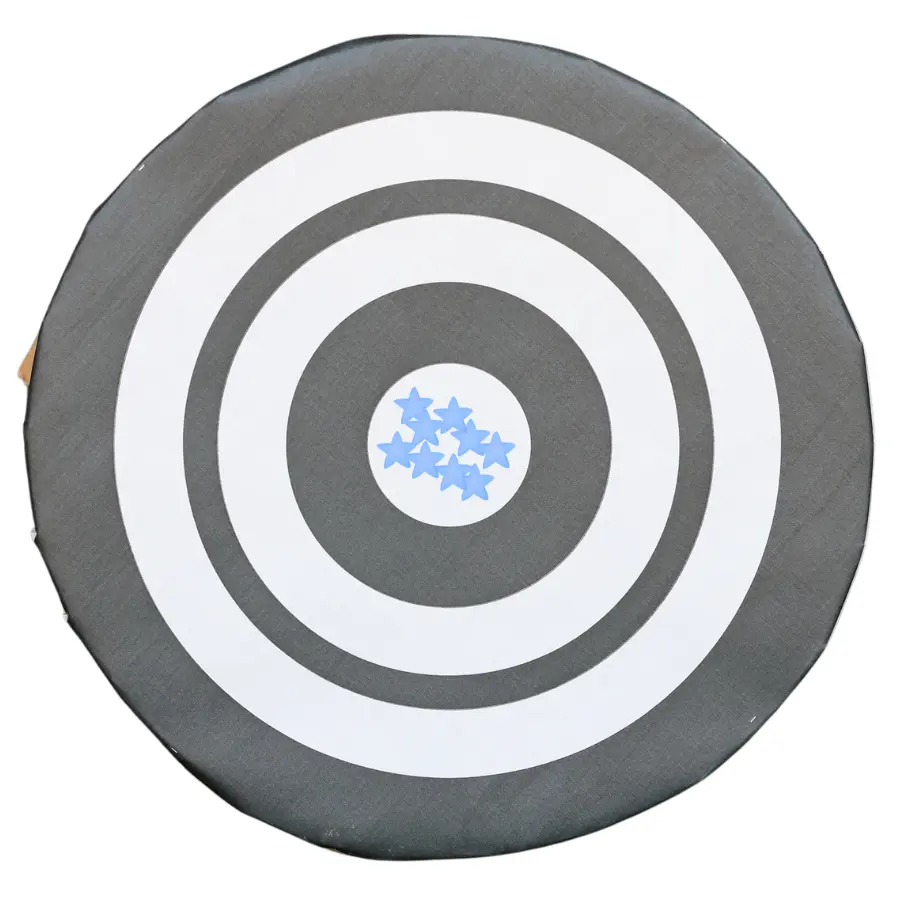
Here, the shots hit the target and are also very close together. It means they are accurate and precise.
Not Accurate and Not Precise
It happens when measurements are not close to each other and not even close to the accepted value. For example,

Here you can see that the shots are far apart from one another. They are also far away from the bullseye. This is an example of not accurate and not precise.
How to Improve Accuracy and Precision in Physics Experiments?
To improve accuracy and precision, correct all the systematic, random, and gross errors in measurements. Use an instrument with high resolution.
Reducing the sources of systematic errors improves the accuracy. Reducing sources of random errors mainly improves precision. Removing gross errors improves both accuracy and precision.
Using a high-resolution instrument reduces instrumental uncertainty. As it reduces the spread, it means the precision is improved.