
Even experiments conducted by a skilled person never yield perfectly exact numbers. Every value, no matter how carefully measured, carries a doubt called measurement uncertainty.
This article will help you understand what measurement uncertainty is, its various sources, and how to reduce it.
Measurement Uncertainty Definition
Measurement uncertainty is the quantified doubt that remains in every measurement result.
For example, suppose you are asked to measure the length of a rod using a ruler. The end of the rod falls between two scale marks on the ruler. As there is no information available between these marks, you have to guess the value, and this guess creates uncertainty.
The doubt in measurement also occurs due to the tiny errors that remain even after corrections. It also occurs due to the imperfections in the instruments we use, the shortcuts or assumptions we make during the experiment, and many other factors explained below.
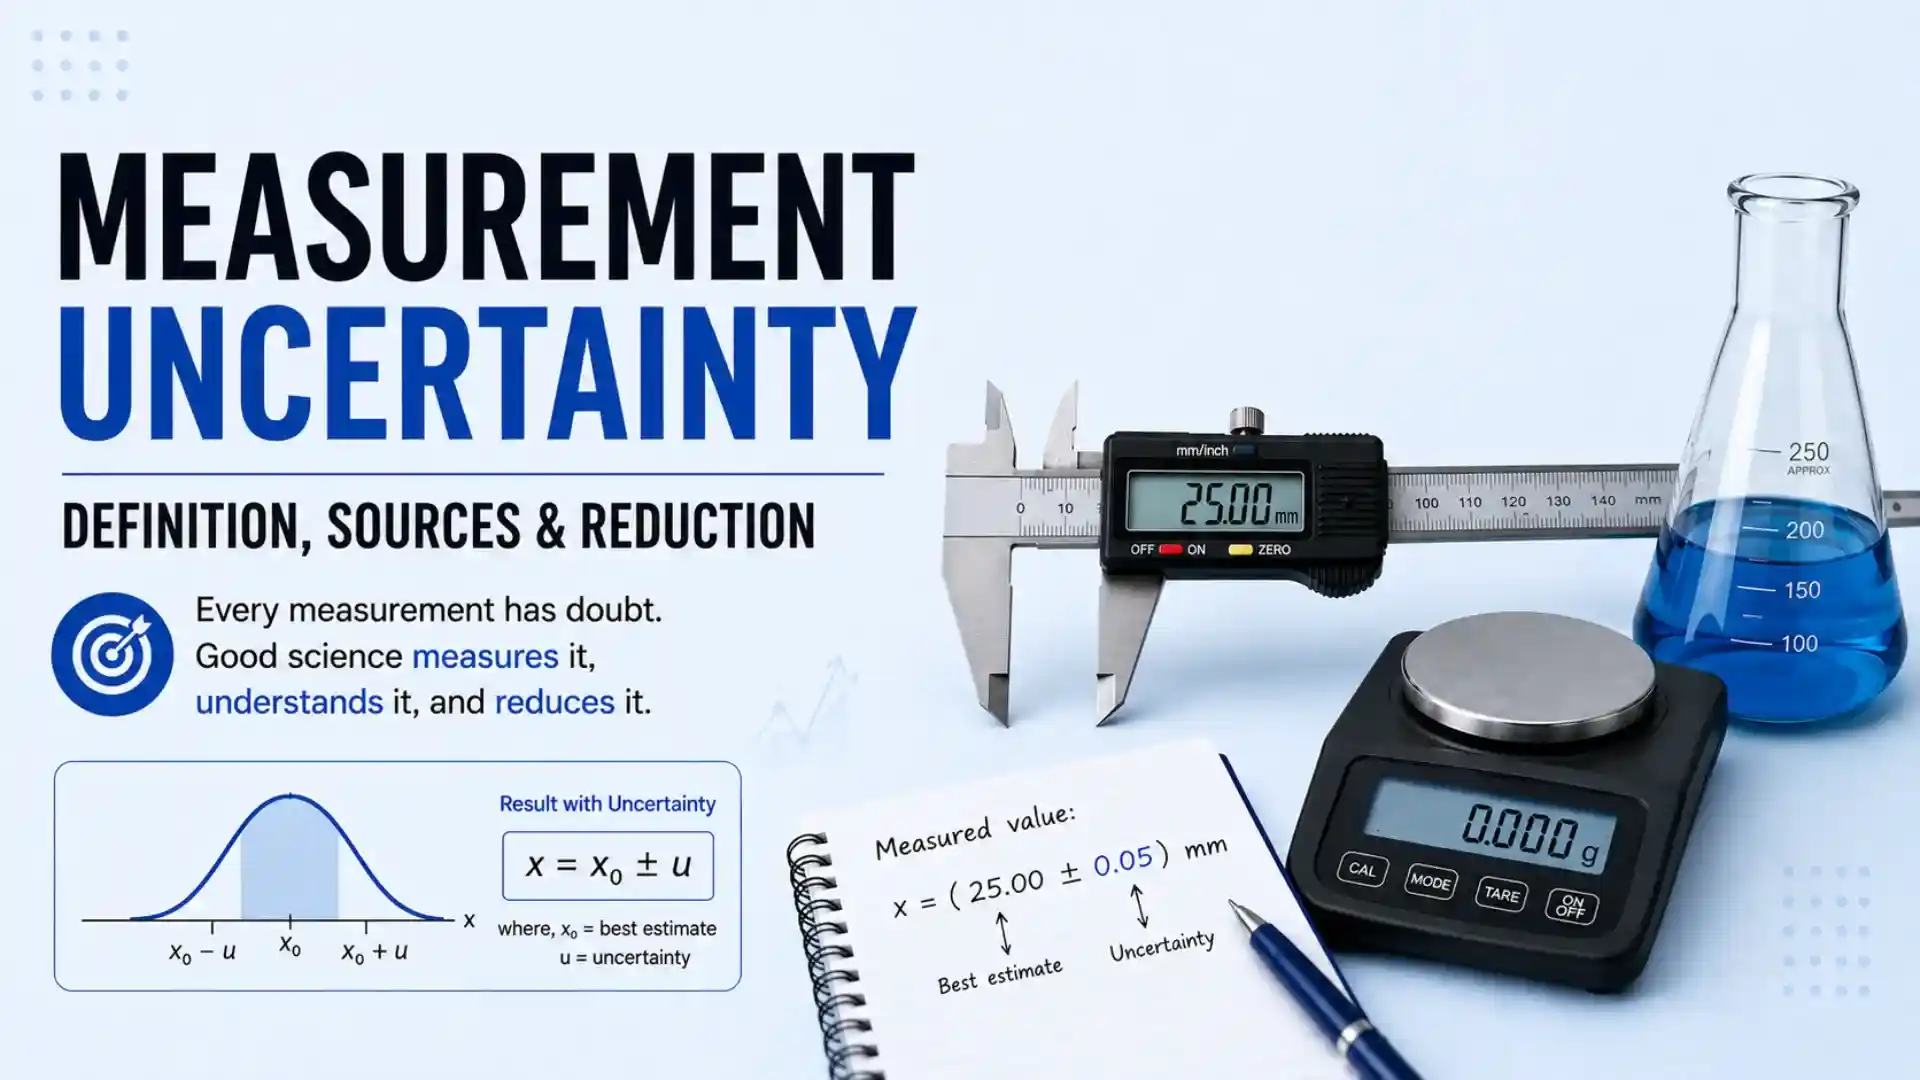
We express this doubt with a number using ±, which shows the spread or margin of values that could represent the measurand.
According to the JCGM 100:2008 guide and VIM (International Vocabulary of Metrology), the measurement uncertainty is defined as
a parameter that characterizes the dispersion of the measured values that could reasonably be attributed to the measurand.
Let’s explain the terms used in this definition to understand it better
- Parameter: It is a number that provides information about the spread (dispersion).
- Dispersion: The spread of the values that can be attributed to the measurand.
- Measurand: The quantity that you want to measure. It could be length, temperature, or any other.
- Reasonable: All measured values that make sense as the value of the measurand are reasonable values.
Imagine you have a rod that is 20 cm long. If you ask several colleagues to guess its length, you might hear answers like around 21 cm, 19 cm, 20 cm, 22 cm, or 18 cm.
However, no one would say the rod is around 5 cm, 1 cm, or 40 cm, because those values do not make sense for a rod of this size.
The values that make sense for a particular measurand are reasonable.
Better tools, skilled people, and good conditions make measurements more exact. It means the range of reasonable values becomes narrower.
Simply put, measurement uncertainty is a number that describes the dispersion (spread) of values that make sense as the value of the measurand.
Generally, the symbol to represent a standard uncertainty of measurement is u. It is the simplest form of uncertainty obtained from a single source of measurement uncertainty, without combining it with other uncertainties.
If we use a coverage factor k with standard uncertainty, it is known as expanded uncertainty, represented by the symbol U. The formula for it is
In physics, it is common convention to represent absolute uncertainty (written as a value with a number and unit) using the Greek letter Δ (delta). If the quantity is force (F), the uncertainty in it is represented by the symbol ΔF.
It is best practice to correct all known errors before evaluating measurement uncertainty.
Uncertainty is not the whole error. It is the small part that remains after we correct the errors we know. The residual error is one of the many sources of uncertainty.
Uncertainty tells us about the quality of a measurement result. If the uncertainty is large, the true value could be much higher or much lower than the number we measured. Because the spread is wide, the true value could be far away from the measurand. We cannot trust measured values strongly when making decisions or comparisons.
Mathematically, we write uncertainty with the best estimate of measurement using the ± sign.
The best estimate is obtained by taking the mean of repeated measurements and applying corrections for known systematic errors. The sign ± represents the interval that covers all the values that lie in the interval
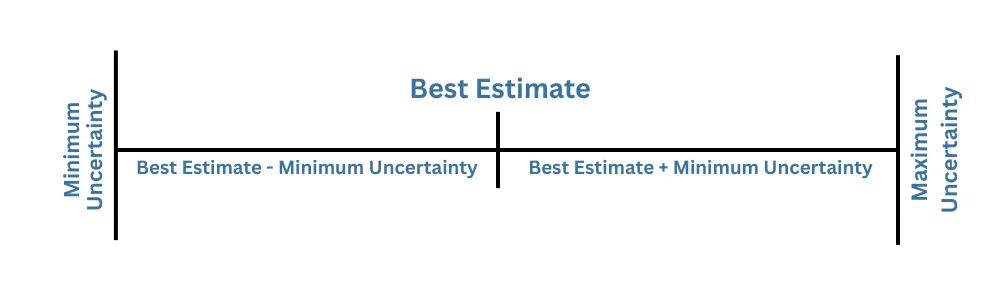
[xmin,xmax]
Where
xmin = Best estimate – Uncertainty
xmax = Best estimate + Uncertainty
10 Hidden Sources of Uncertainty in Measurement
There are various sources (or causes) of measurement uncertainty. Some of them are as follows:
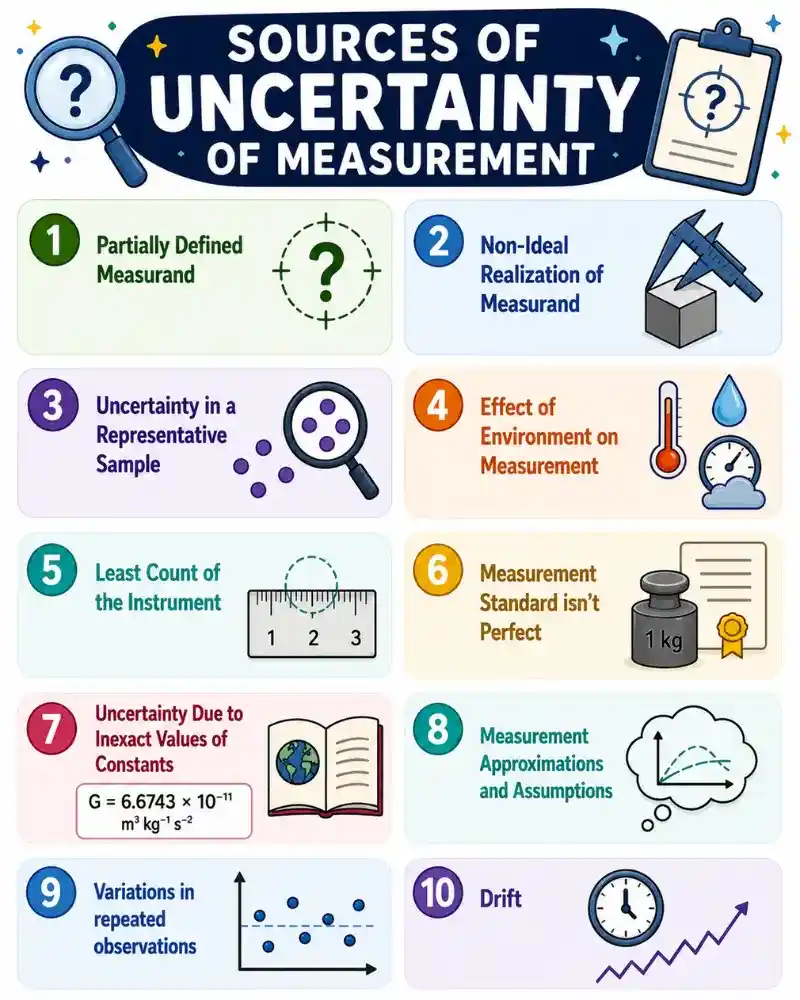
1. Partially Defined Measurand
The quantity we want to measure can not be specified by a number. As we don’t know its value yet. Instead, we describe the quantity by specifying its feature. For example,
Measure the temperature of 1 liter of distilled water in a glass container. The water is kept in a thermostatic bath at atmospheric pressure (101,325 Pa). Measure the temperature at the geometric center of the container after it has warmed up evenly. The temperature is shown in degrees Celsius.
The measurand can be described perfectly if we have an infinite amount of information about it. Since it is not possible to get an infinite amount of information about the measurand, that leaves room for uncertainty.
2. Non-Ideal Realization of Measurand
In the previous example, we want to measure the temperature. And we describe its features as
- 1 Liter of distilled water
- Thermostatic bath
- Atmospheric pressure (101,325 Pa)
- Geometric center
- Warm up evenly
Even if we try to realize the quantity according to these specifications, no instrument can give an exact number. It is not possible to have exactly 1 liter of water or perfectly control the bath temperature.
Because of this, the realization is only an approximation of the measurand. This small difference between what we want to measure and what we actually get to measure adds to the uncertainty of measurement.
3. Uncertainty in a Representative Sample
Most of the time, it’s too hard or impossible to measure the whole object. Especially when you’re working in factories or on a large scale.
To make things practical, we take a small sample instead of measuring everything.
But the problem is: In a big object, different parts may not be exactly the same. So, the sample we take might not perfectly represent the whole object.
Example: Imagine a large tank of sugar solution in a factory. If we take just a small spoonful to measure the sugar concentration, it might not match the sugar concentration in the whole tank. This difference causes uncertainty in our measurement.
4. Effect of Environment on Measurement
Environmental factors, such as temperature, pressure, or humidity, can affect the measurement. These effects may introduce both random and systematic errors in the measured values.
Repeated measurements and appropriate corrections can reduce the impact of these variations. But we cannot completely remove them. The small effects that remain contribute to the overall uncertainty of the measurement.
Some of the most common environmental factors are as follows:
- Temperature
- Humidity
- Air movement
- Pressure
- Electric or magnetic fields
- Gravity
- Electrical supplies for measuring equipment
5. Least Count of the Instrument
Every measuring instrument has a smallest value it can detect, called its least count or resolution. If the quantity we are measuring is smaller than that, the tool can’t detect that part. This limit adds uncertainty in our measurements.
6. Measurement Standard isn’t Perfect
A measurement standard is something we use as a reference to calibrate other measuring tools.
Since the standard itself has an associated uncertainty, this uncertainty is transferred to the instruments being calibrated. And ultimately contributes to the uncertainty of the measured values.
7. Uncertainty Due to Inexact Values of Constants
To understand this, suppose you’re calculating the gravitational force between two objects using Newton’s law of gravitation:
The symbol G represents the gravitational constant, while m1 and m2 denote the masses of the two objects, and r indicates the distance between them.
When calculating the force, the uncertainty in the value of the constant G propagates into the final result.
8. Measurement Approximations and Assumptions
In experiments, we make assumptions to simplify measurements and calculations. Such as neglecting the effect of the balance pan on the weight of the measuring object. Similarly, in a pendulum, we approximate sin θ ≈ θ.
These approximations and assumptions make the value inexact. Since we don’t know exactly how much, they add to the uncertainty in our measurements.
9. Variations in repeated observations
Uncertainty can also arise from sudden, unpredictable variations in the instrument, the environment, or the experimenter’s method.
If you measure the same quantity many times under the same conditions, you would see that the measured values vary slightly from one another. These variations are unpredictable and random, so there is no way you can control them.
You can reduce their effect by taking the average of all the measurements. The small differences that are still left are considered part of the measurement uncertainty.
10. Drift
No measuring instrument remains perfectly stable over time. As time passes, mechanical parts, electronic components, and sensors slowly change their properties. These changes cause the readings of the same quantity to differ in a systematic way.
After applying corrections, the remaining residual effect contributes to the measurement uncertainty. The change in the instrument’s properties due to the passage of time is known as the drift in the instrument.
Why Can No Measurement be Exactly Correct?
A measurement can never be exactly correct because it is always affected by different sources of uncertainty that you cannot avoid completely.
We can reduce the uncertainty of measurement by using better and more precise instruments, controlling environmental conditions, and employing expert operators. But it is not possible to eliminate uncertainty completely to get an exact value.
How can Measurement Uncertainty be Reduced?
There are several approaches that can help minimize uncertainty when taking measurements. A few of them are given below
Collect More Data
The more data you collect, the more the random effects cancel out, making your dispersion of measurand values closer to the true value.
Define Measurand with more Detail
As mentioned earlier, a measurand can be defined perfectly only if we have an infinite amount of information about it, which is not possible. In practice, we can reduce measurement uncertainty by specifying as much relevant information about the measurand as possible.
Change Measurement Conditions
You can reduce uncertainty by performing the measurement in a more controlled environment.
Change one thing at a time, like temperature, humidity, or air movement, and see how it affects your results. This helps you find out which environmental factors keep your measurements steadier and reliable.
Also, try to test different experts or instruments to check whether they improve your results or not.
Select a Lab with Better Conditions
If you measure quantities in a lab that carefully controls the environment and instruments, you can get better results. You can also compare different labs by reviewing their past measurement data for the type of measurement you perform.
This helps you analyse which lab gives more reliable results for the type of measurement you want to do.
If you choose a well-controlled and reliable lab, you can reduce the uncertainty in your final measurements.
Select a More Precise Instrument
If you choose a more precise instrument, you can measure the quantity with a finer resolution, giving you more reliable digits in your result.
As a result, the overall uncertainty decreases because the instrument provides values that are closer to the true value.
Avoid Approximations and Assumptions
Scientists use approximations and assumptions to simplify the measurements and calculations. But these approximations and assumptions introduce extra uncertainty in your value. Whenever possible, avoid relying on them to reduce uncertainty in the final result.
Improve Sample Collection Method
If you are working in a factory and take a sample from a large quantity to measure the concentration of different elements in it.
Identify factors that can increase uncertainty. For example, workers may not mix the material evenly, or the sample you take may be too small. Reduce uncertainty by thoroughly mixing the material and choosing a slightly larger sample.
Measurement Error vs Uncertainty
It’s common for people to confuse measurement error with measurement uncertainty. But the two concepts are distinct.
Measurement error quantifies the difference between the measured value and the true value. It tells us how far off a measurement is from reality.
Measurement uncertainty reflects the spread or range of values that can be associated with the measurand. It captures the inherent doubt in a measurement.
Note: The unrecognized systematic errors don’t contribute to measurement uncertainty.