
If your experiment results don’t match textbook values, it’s not always your fault. Some errors in measurements are unavoidable. Once you understand the different types of errors, your experimental results finally start to make sense.
In this article, you’ll discover what measurement errors are, their various types with examples, how to reduce them, and how to calculate them correctly.
What is a Measurement Error?
The deviation of the measured value of a quantity from its true value (actual value) is known as measurement error.
The true value is the actual value of a quantity that is completely free from errors and uncertainties.
As these errors occur during experiments, they are also known as experimental errors.
The process of examining all the errors that enter into the measuring result is called error analysis.
Experimental errors or measurement errors can affect the readings in three different ways. On the basis of it, we have classified them into different types.
What are the Different Types of Errors in Measurement

Broadly, the errors in measurement are of three types
- Random Error
- Systematic Error
- Gross Error
Random Error
When you measure the same quantity again and again under the same conditions but still get slightly different results, the variation in these results is due to the error known as random error.
We know the causes and sources of these errors, but the exact variation they cause in each measurement is unpredictable.
These errors happen because some things keep changing randomly, and we can’t control them. That’s why we can never remove these errors completely.
Sources of Random Errors in Measurements with Examples

We handle random errors statistically (e.g., averaging) rather than categorically. So, categorizing them into different types is of no use. We just apply the statistical methods and reduce the random error.
That’s why we discuss only the sources here.
Three different types of sources can cause random error
- Environmental Sources
- Instrumental Sources
- Observational Sources
Environmental Sources
Random errors can arise from sudden fluctuations in environmental conditions, such as temperature, pressure, or vibrations.
For example,
1) While measuring the voltage of a battery through a multimeter, minor fluctuations through nearby electrical devices like fans, fluorescent lights, and Wi-Fi routers can create electromagnetic fields that introduce noise into the multimeter’s circuit.
2) Paper can get a little heavier or lighter on the weighing balance due to the fluctuations in humidity. As the paper absorbs or loses water from the air.
3) Tiny air currents from a fan, window, or even your breathing can make a light object’s weight fluctuate on a digital scale. Because these air movements change unpredictably, each measurement comes out slightly different.
Instrumental Sources
The random error could also be due to some random fluctuations within the instrument. For example,
1) The multimeter reading can be slightly wrong because of its own small electronic noise inside the device.
2) In an analog meter, the needle’s internal parts, like the coil, spring, magnet, and bearings, have tiny natural imperfections and micro-movements that make the needle wobble unpredictably.
These small internal changes occur on their own, even when the measured value is steady.
3) Measuring steady light intensity, the output fluctuates slightly.
This happens because the photodiode inside the sensor receives photons in a naturally random way, sometimes a few more arrive, sometimes a few fewer, and this randomness creates shot noise.
The sensor’s electronics also add their own tiny variations, so together they cause small, unpredictable changes in the output.
Observational Sources
Small random variations that happen due to the experimenter’s imperfection, like tiny hand shakes, inconsistent eye focus, and reaction time variation.
Examples of random errors through observational sources are:
1) When you measure the time of an oscillation, your reaction to start or stop the stopwatch can change a little each time. As a result, each recorded time differs slightly from the true value.
2) When you step on a scale, tiny changes in your posture, foot position, or balance happen each time, causing small differences in weight.
These variations have no consistent direction, sometimes the measurement is slightly higher, sometimes slightly lower.
3) When measuring the length of a pencil, your eye can be slightly off the mark each time, causing small, unpredictable variations in the measurement.
How to Reduce Random Error
The most common and effective method to reduce random errors is to take multiple measurements and then calculate their mean.
Each time you measure, the reading may be slightly above or below the true value due to small, unpredictable variations.
By taking several measurements, the errors above and below the true value tend to balance out, and their average gives a value closer to the true value.
The more measurements you take, the smaller the impact of random errors becomes.
Systematic Error
If you take multiple measurements of a quantity under the same conditions, and each measurement shows a consistent difference from the true value, the error is called a systematic error.
These errors have predictable variations as they cause the same change in every measurement. Also, the results are either higher or lower than the true value.
The systematic error can be fixed (constant) or proportional.
In systematic fixed error, the error remains the same amount, no matter how much the quantity is. It doesn’t rely on the quantity you measure.
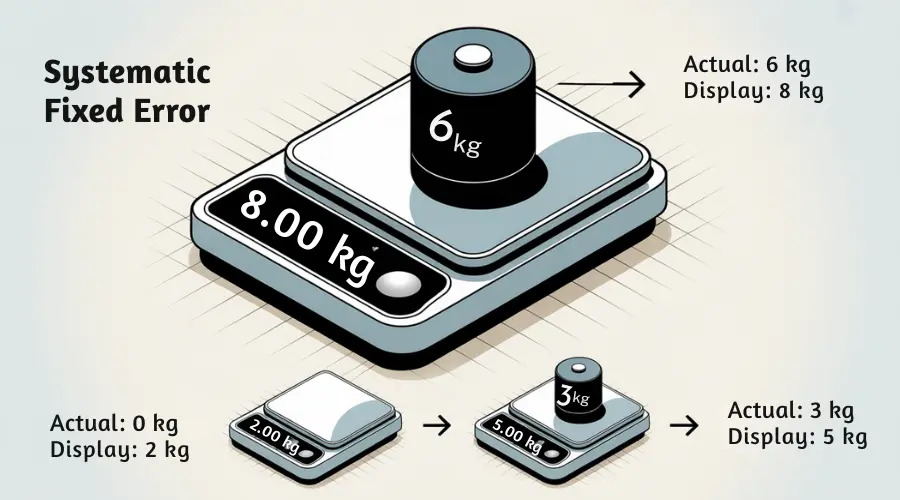
For example, if a weighing scale reads 2 kg when it’s empty, it has a zero error of +2 kg. This is a systematic fixed error because the error doesn’t increase or decrease when the quantity changes.
So, if you place 3 kg on the scale, it will show 5 kg, and if you place 6 kg, it will show 8 kg.
As these errors are fixed absolute value, the relative or percent error would look huge when the sample quantity is small, and it would look small when the sample quantity is huge.
In systematic proportional error, the error changes proportionally as the quantity of measurement changes.
It means the percentage of error is fixed, but the absolute error increases as the value increases and decreases as the value decreases.
To understand it, suppose you are using a meter rule made of steel that was calibrated at a temperature of 15 °C.

During summer, as the temperature rises, the metal ruler expands slightly. As a result, each centimeter marking moves slightly farther apart.
If the ruler expands proportionally by 0.1%, the measured length of an object will be slightly less than the true length, because fewer ruler divisions fit along the object.
- The instrument measures a 10 cm object as 9.99 cm. Absolute error is −0.01 cm
- It measures a 50 cm object as 49.95 cm. Here, the absolute error becomes −0.05 cm
- A 100 cm object will be measured as 99.9 cm. In this value, the absolute error is −0.1 cm.
- The instrument measures a 200 cm object as 199.8 cm. Here, the measured value has an absolute error of −0.2 cm.
You can analyse, as the measured value increases, the absolute error increases as well. But the relative error or percentage error is the same, 0.1%.
Types of Systematic Error in Measurement with Examples
Classifying systematic errors is useful because identifying the type allows correction or calibration.
There are three main sources that can produce systematic errors. Each type of error is named according to the source that causes it.
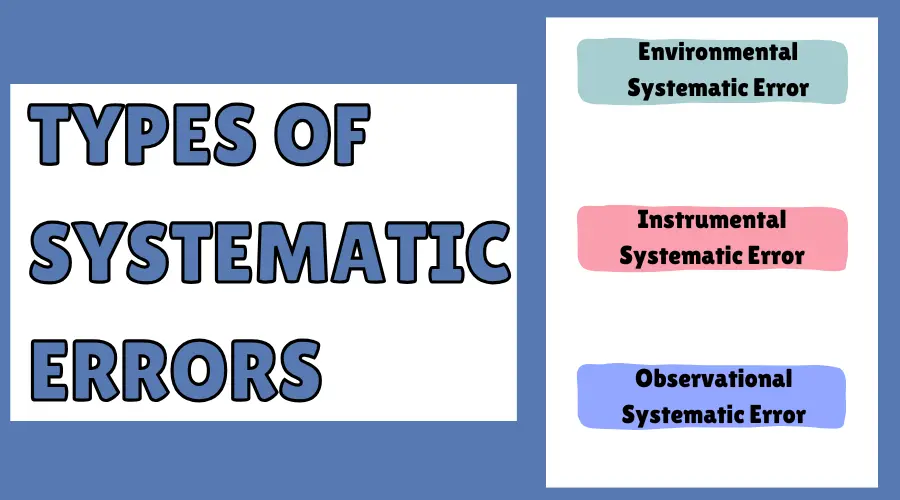
- Environmental Systematic Error
- Instrumental Systematic Error
- Observational Systematic Error
Environmental Systematic Error
Environmental systematic errors are consistent errors in measurement that result from environmental factors. Such as temperature, humidity, pressure, or external electric and magnetic fields.
As it repeats in every measurement the same way, it is predictable.
Let’s understand it with examples
1) A meter rule expands or contracts with temperature because of the thermal expansion of the material.
In summer, the ruler’s markings are slightly farther apart, so measured lengths appear shorter than the true length.
In winter, the markings are closer together, so measured lengths appear longer than the true length.
2) A sensitive weighing scale absorbs moisture in high humidity. Every measurement shows a slightly higher weight than the true value.
The error remains the same in each measurement, as the humidity remains constant.
3) An ammeter placed near a strong magnet shows a slightly higher or lower reading than the true current value. The error occurs consistently as long as the magnetic field is present.
Instrumental Systematic Error
A consistent, predictable error that occurs due to the measuring instrument itself is known as instrumental systematic error.
The instrument might be old, poorly maintained, or miscalibrated, which can cause it to give consistently wrong readings.
Examples:
1) Zero error is a systematic error caused by the instrument itself. This means it is consistent and predictable. It occurs when the instrument does not read zero even when nothing is being measured.
Because the starting point is already wrong, the instrument shifts every measurement by the same amount.
2) If the markings on the thermometer are farther apart than they should be, each division represents a larger temperature interval than intended.
So, when the mercury rises to a certain level, the thermometer reads a lower temperature than the true temperature.
3) Suppose the laboratory staff do not clean the weighing balance regularly. Dust, grease, or rust accumulates on the pans and pivots.
This extra weight causes the balance to consistently read slightly higher or lower than the true weight.
Observational Systematic Error
The observational systematic error is a consistent, predictable error that happens due to the person measuring the value in the same wrong way each time.
Examples:
1) Parallax error is an observational systematic error. It occurs when you look at a scale or meniscus from an angle, which makes the reading appear higher or lower than it really is.
Keep your eyes aligned horizontally with the mark you are reading to avoid parallax error.
2) Always placing the object incorrectly (e.g., starting from 1 cm instead of 0 cm). Every length measurement is off by the same amount.
3) When timing events with a stopwatch, the experimenter may have a habitual delay of 0.2-0.3 seconds in starting/stopping. This small delay consistently skews all time measurements.
How to reduce systematic error
Unlike random error, systematic error cannot be reduced using the mean method. As the error only proceeds in one direction.
Either high or low.
If you repeat the same measurement with the same instrument again and again, it won’t help you detect the systematic error in any way.
Once you have averaged out the repeated measurements to reduce the random error. And still your value deviates from the known true or accepted reference value. You need to reduce the systematic error.
To reduce systematic errors, you must first identify their type.
You can detect these errors by carefully analyzing the surroundings, the measuring instrument, and the experimenter’s method.
Each experiment can face different kinds of errors. Follow the procedure to detect and reduce them given in your textbook or provided by your instructor for a certain experiment.
Random vs Systematic Errors
Now that you understand random and systematic errors, seeing their differences side by side makes it much clearer. Take a look at the table below.
| Random Error | Systematic Error |
|---|---|
| The random error occurs due to the random, unpredictable variations. So, the error varies from one measurement to the other. | The systematic errors occur due to the consistent, predictable variations. The error is constant in each measurement. |
| The source of this error is random fluctuations in the environment, instrument or experimenter. | The source of this error lies in consistent variation in the environment, instrument, or experimenter. |
| In multiple measurements, the measured value can be more or less than the true value. The values scatter around the true value. | The error in multiple measurements varies by the same fixed or proportional value. The values are either high or low. |
| This error is reduced by taking the average of multiple measurements. The more the measurements, the lesser the random error becomes. | The method for reducing a systematic error depends on its type. The instructions for doing so are usually provided in the textbook or by your instructor. |
| The error can be detected by repeated measurements. | This error cannot be detected by repeated measurement. |
Gross Error
Gross errors are large, obvious mistakes or blunders made by the experimenter while taking or recording measurements. These mistakes are made by accident, not intentionally.
Gross Error is also known as a blunder or mistake.
Examples of gross error:
1) If a thermometer reads 28 °C for a water bath but the experimenter mistakenly writes 82 °C, that is a gross error.
2) Misplacing a decimal point while writing the readings, like instead of 0.52 cm, the experimenter writes 5.2 cm.
3) The measuring scale shows the value in centimeters, but the experimenter accidentally records it in meters.
How to minimize gross error
Gross errors are often big, obvious mistakes made by accident, so they are easy to spot.
By finding and fixing these errors, you can completely remove them from your measurements.
How to calculate Errors in Measurement?
We calculate errors in measurement in two ways:
- Absolute Error
- Percentage Error (also Fractional Error or relative error)
How to Calculate Absolute Error?
Absolute error is simply the numerical difference between what you recorded and what the true value really is.
It tells you how far your measured value is from the actual, correct value.
Mathematically,
\[Absolute\;error=Measured\;value-True\;value\]
In reality, it is impossible to measure the true value. As we don’t have the perfect instrument, environment and observer, or experimenter.
Instead, we use the mean method of statistics to estimate a value that is very close to the true value. To do this, we measure a single quantity multiple times and then take its average.
We then compare this average value with each individual measurement to estimate the absolute error. So, we write the absolute error as
\[Absolute\;Error=Measured\;value-Mean\;value\]
How to Calculate Percent Error
To calculate the percent error in a measurement, divide the absolute error by the true value, and then multiply the final result by hundred. Mathematically,
\[Percent\;Error=\frac{Absolute\;Error\;}{True\;value}\times100\]
or
\[Percent\;Error=\frac{Measured\;value–True\;value}{True\;value}\times100\]
As mentioned earlier, we can’t measure the true value in reality. So instead of the true value, we use the mean value to calculate percent error. Hence, the percent error formula becomes
\[Percent\;Error=\frac{Mean\;absolute\;error}{Mean\;value}\times100\]
Where the value of the mean absolute error is calculated as
\[Mean\;absolute\;error=\frac{\sum_{i=1}^n\;\left|a_i-m\right|}n\]
Where “ai” is the measured value, and “m” is the mean value. The sign ∑ represents the sum of all absolute errors, and “n” expresses the number of observed values or the number of absolute error values.
If we remove the percent part, the error is also referred to as fractional error or relative error.
Fractional Error Formula:
\[Fractional\;Error=\frac{Mean\;absolute\;error}{Mean\;value}\]
What is an acceptable percent error in physics?
The acceptable percent error depends on the precision of the instrument and the context of the experiment, so there is no universal rule.
During my BS Physics studies, some of my teachers considered a 5% error acceptable, while others did not accept errors greater than 3%.
In my opinion, it’s best to keep your error below 5%. If your instrument is not very precise, try not to exceed 10%.
A percent error of around 10% is usually acceptable. But errors above that suggest your measurement is inaccurate and needs careful review.